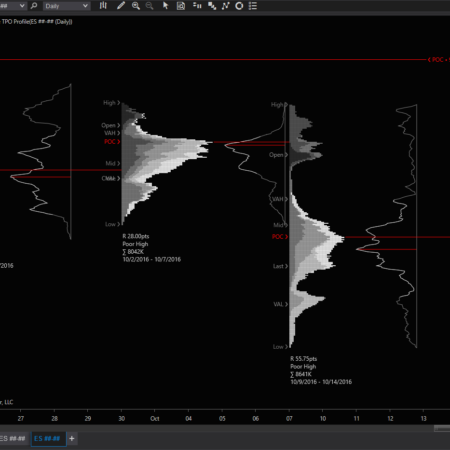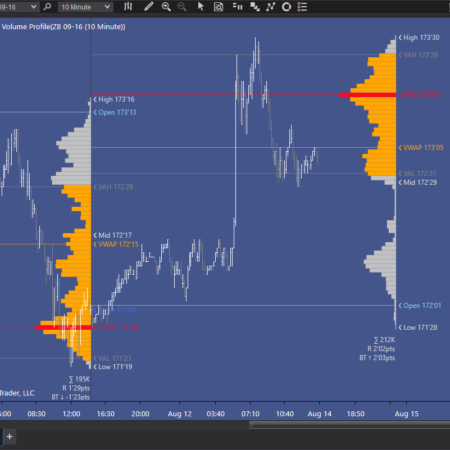

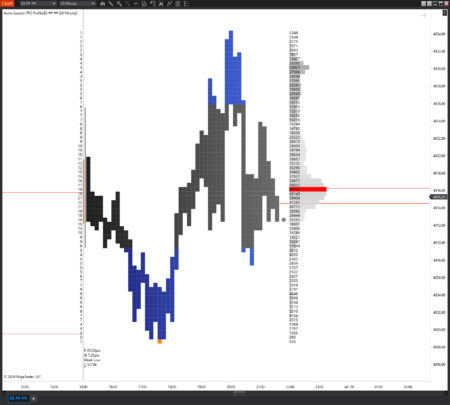
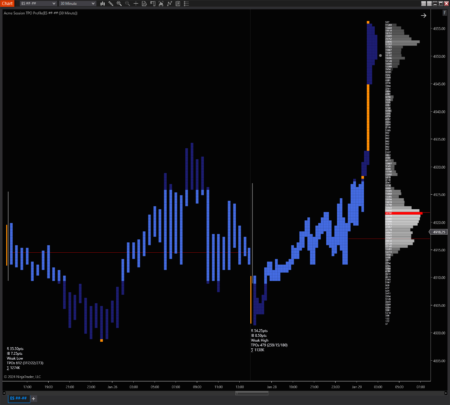
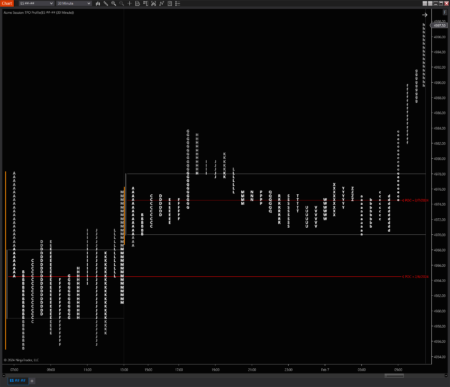
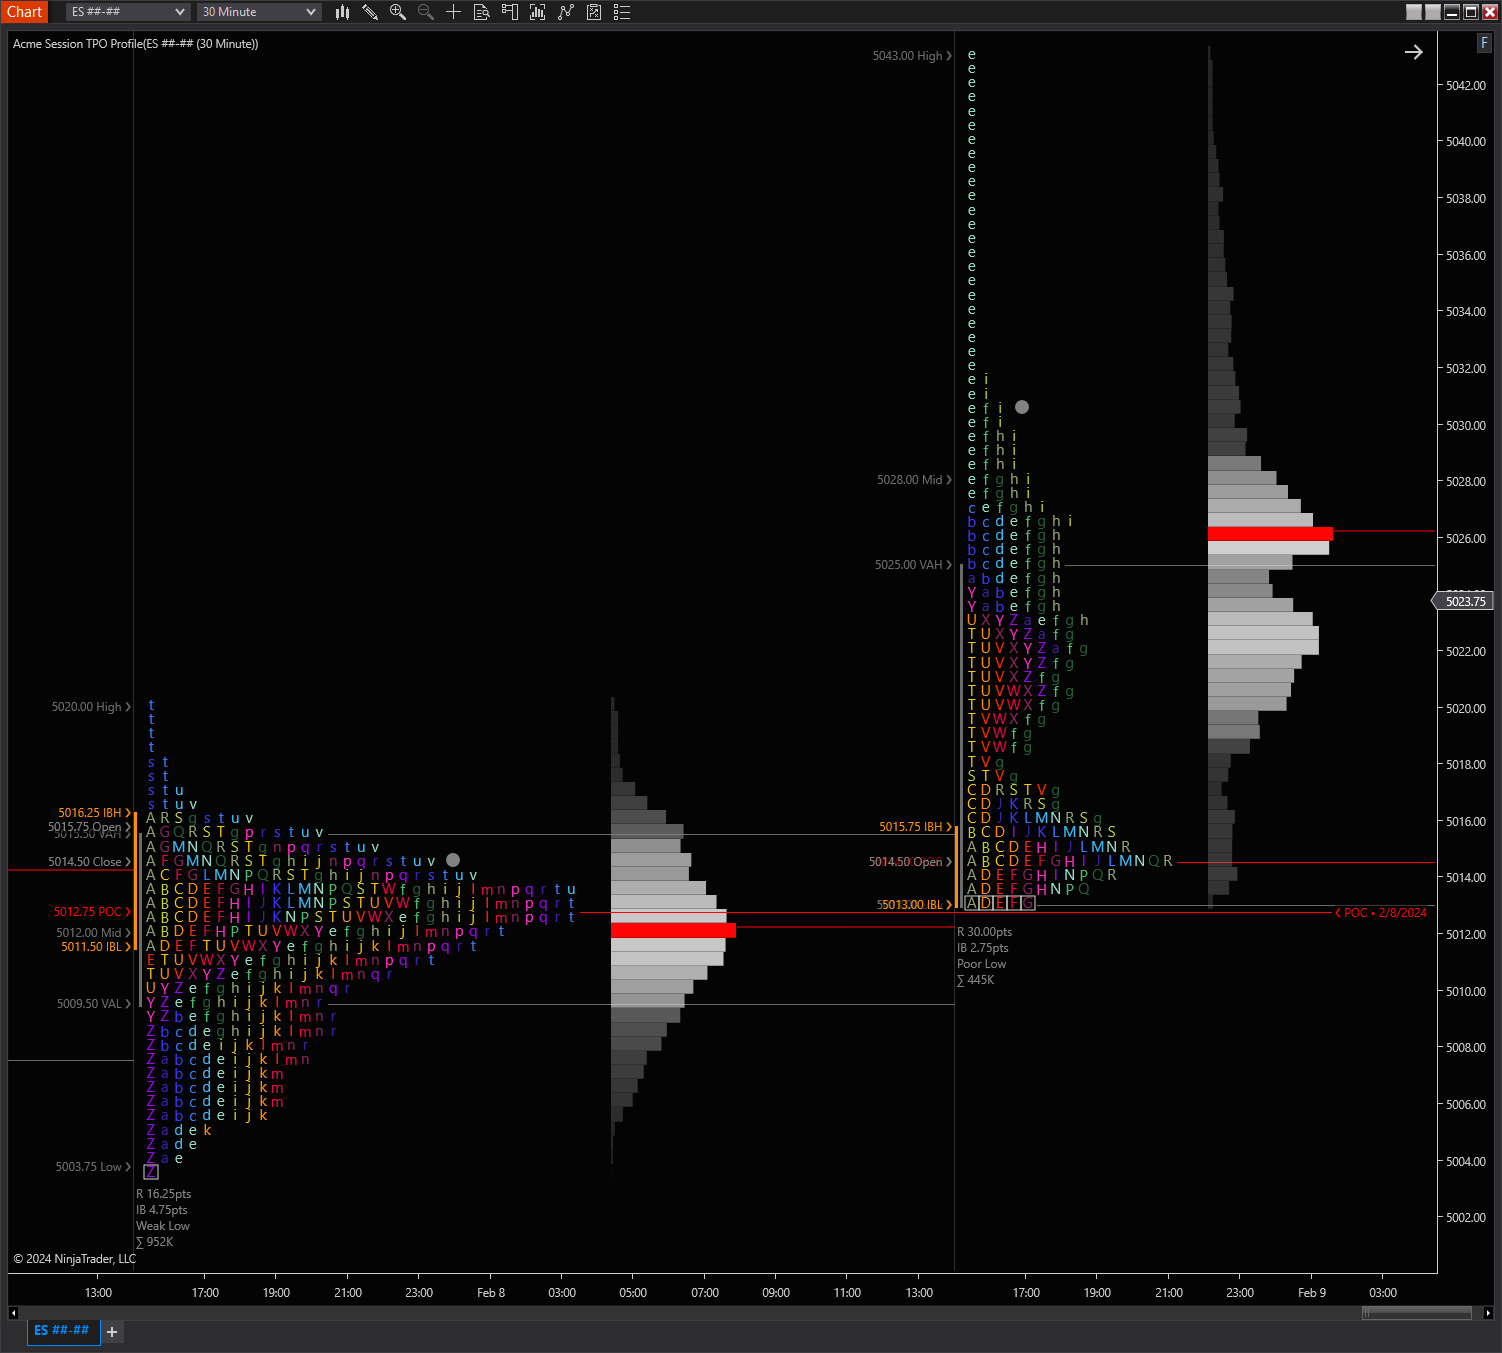
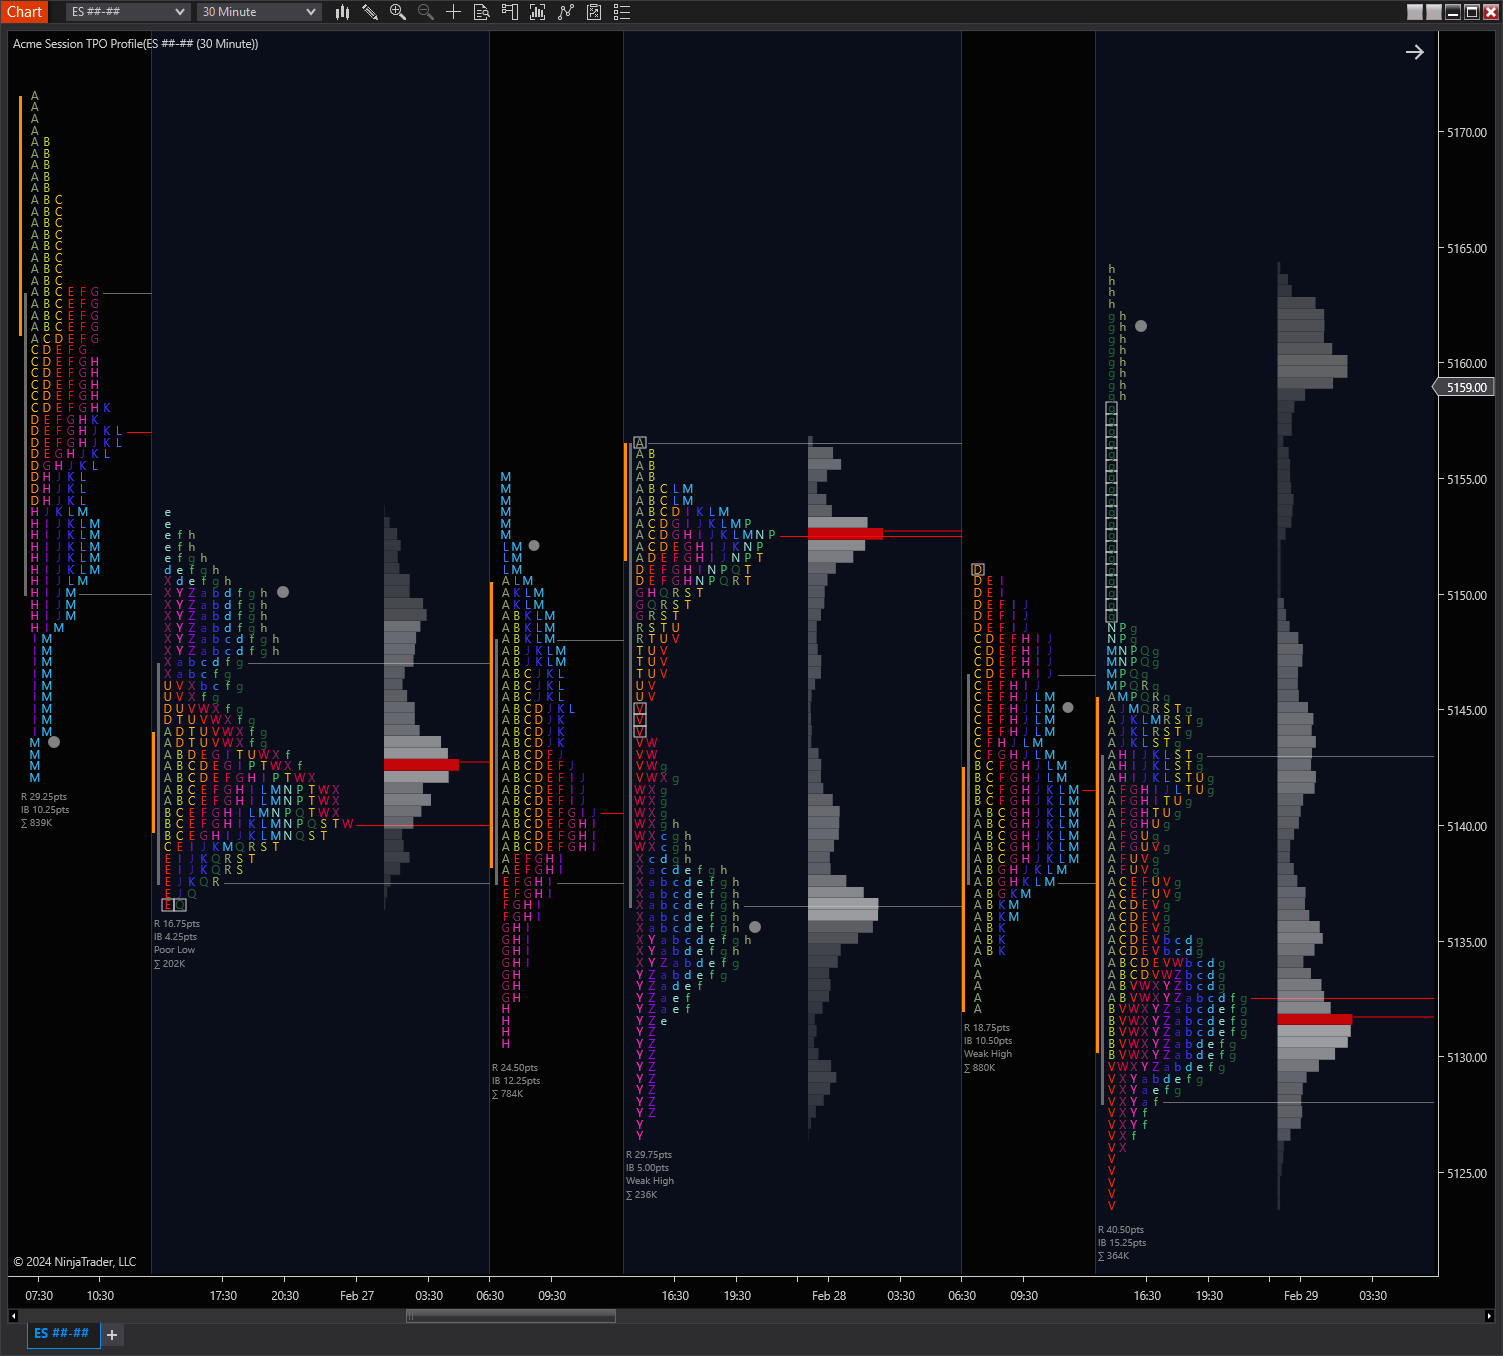
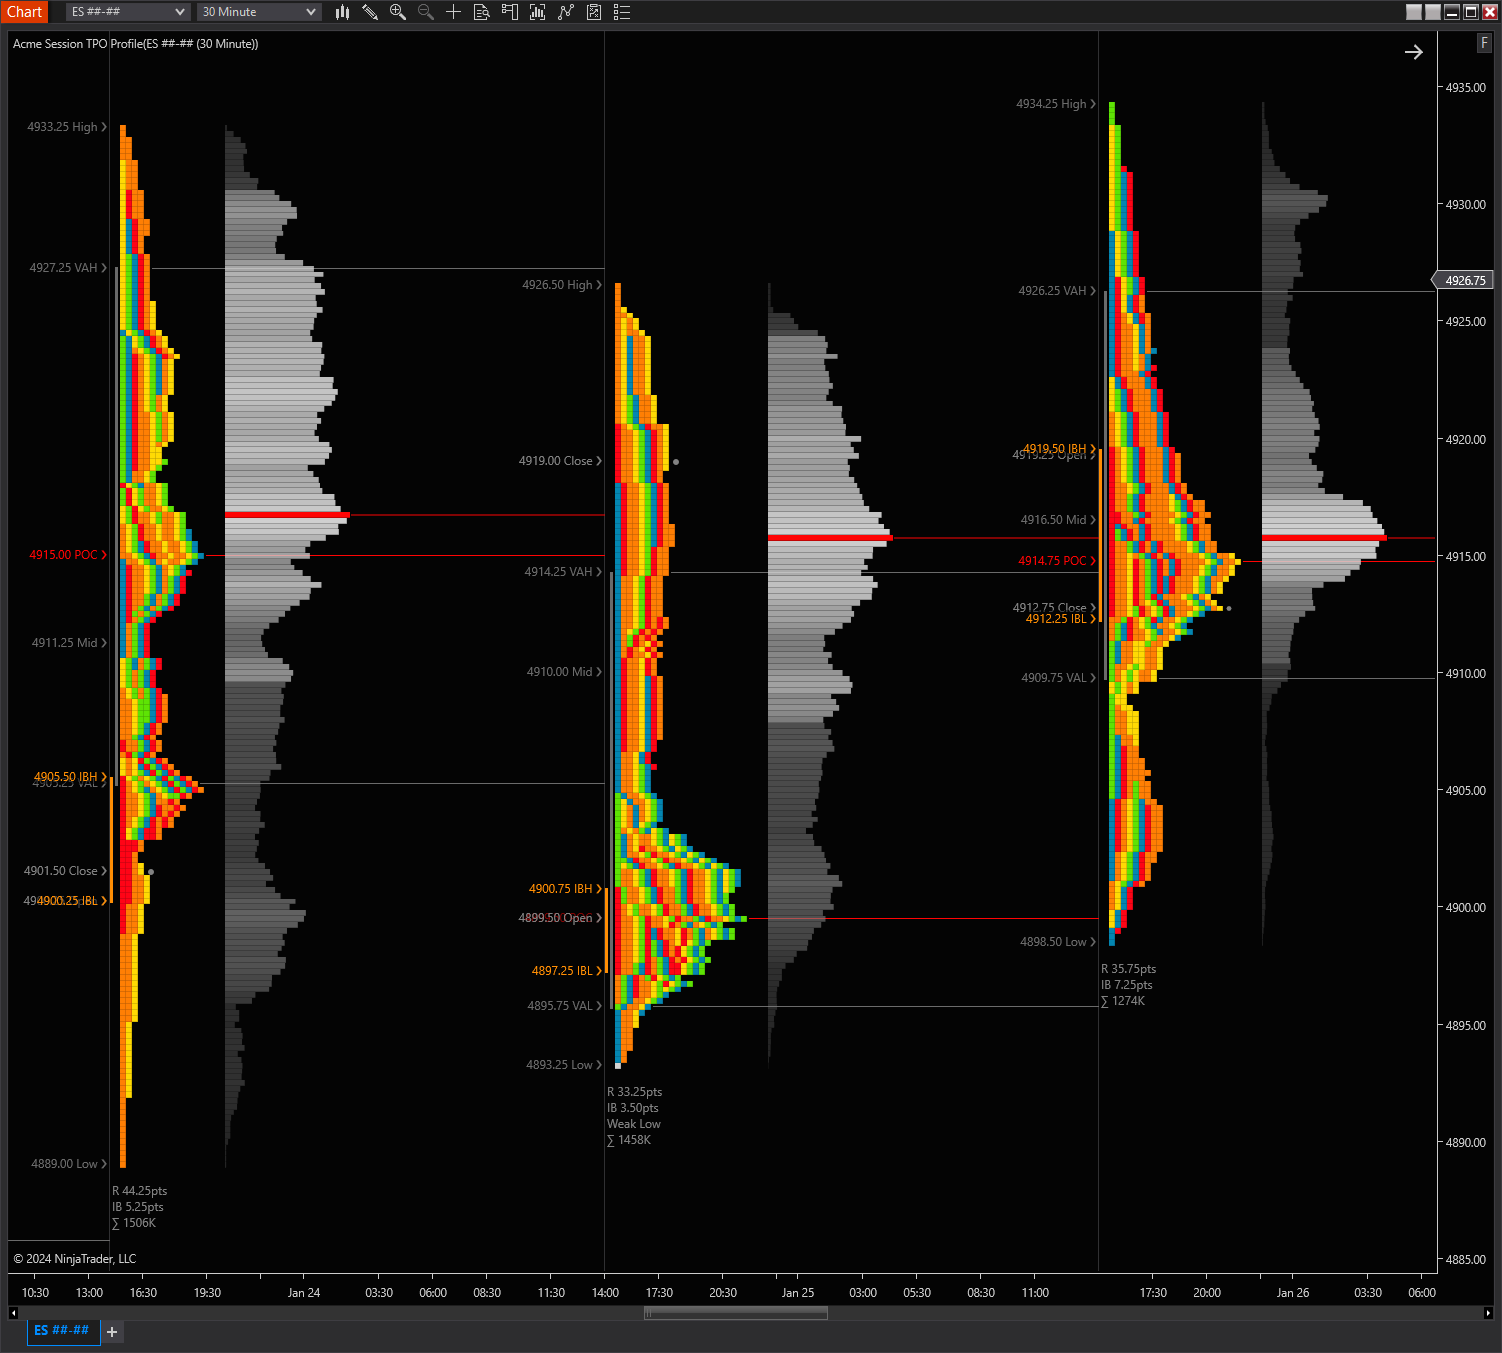
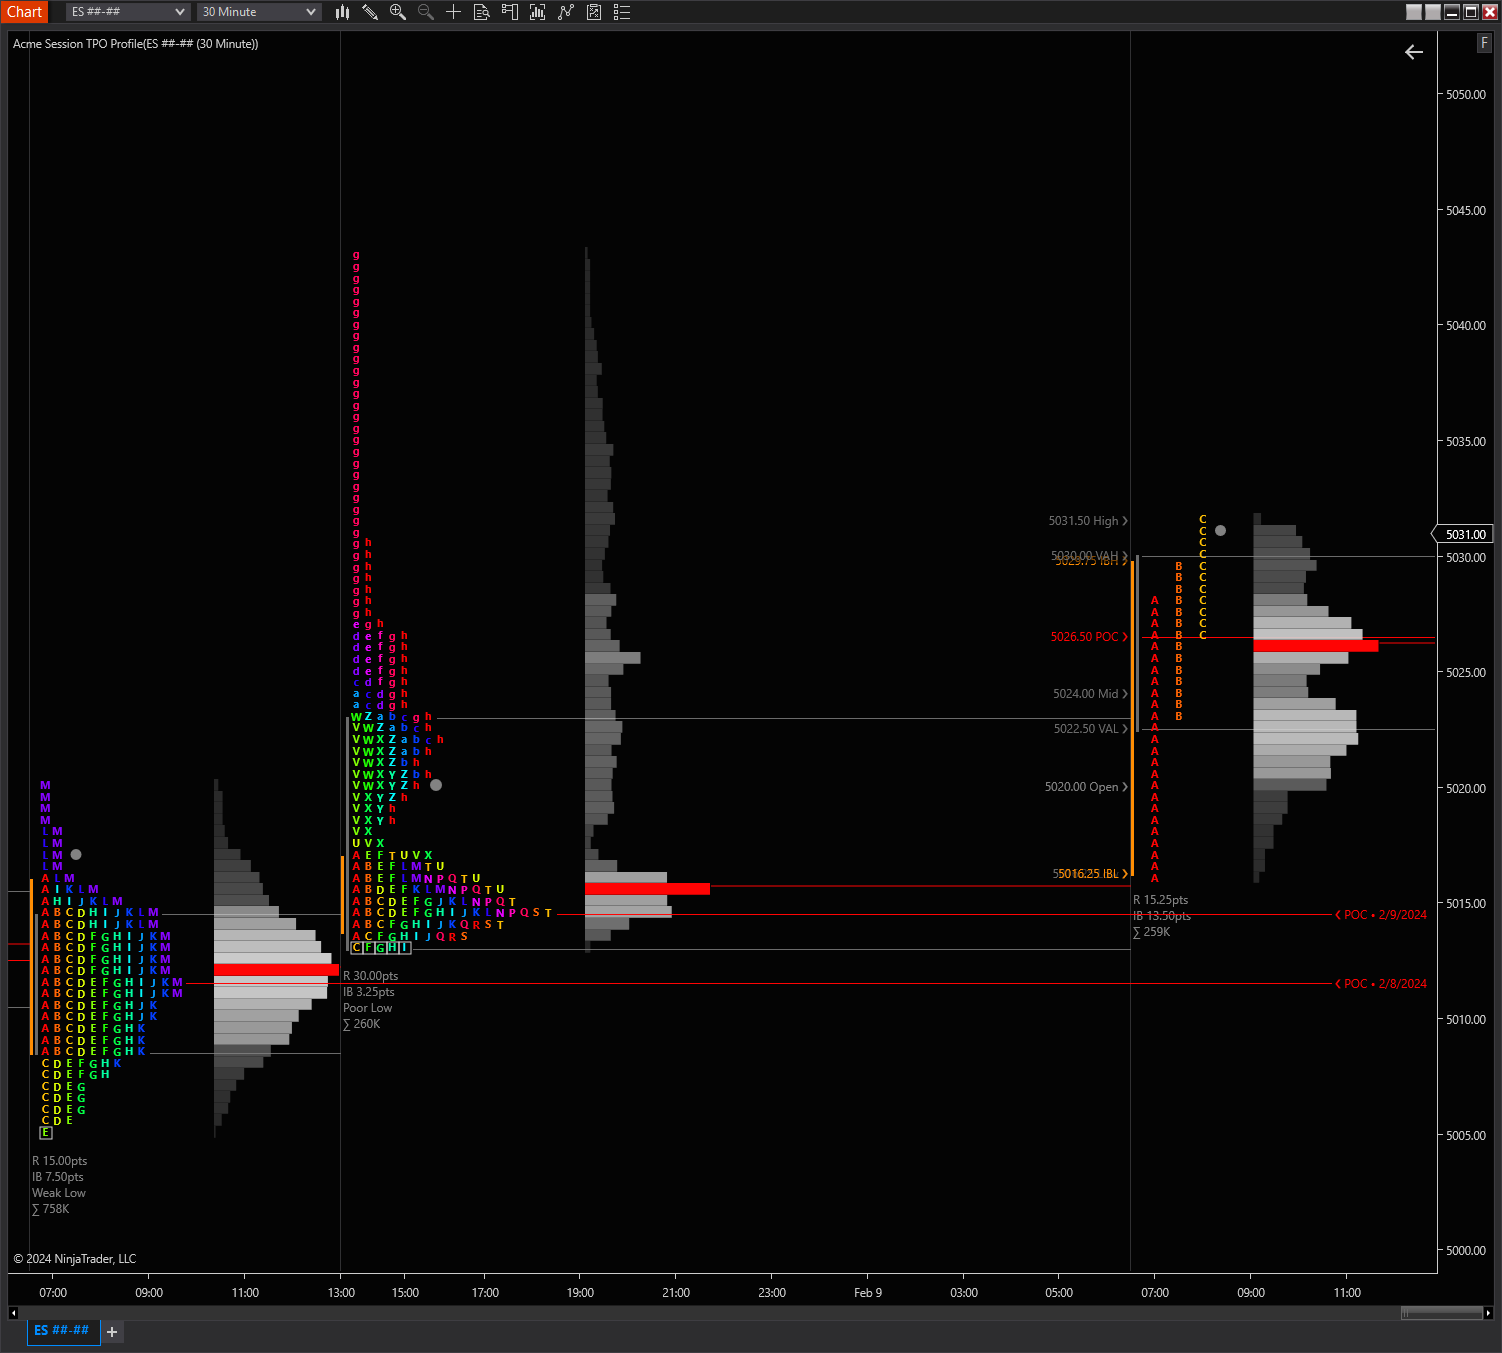
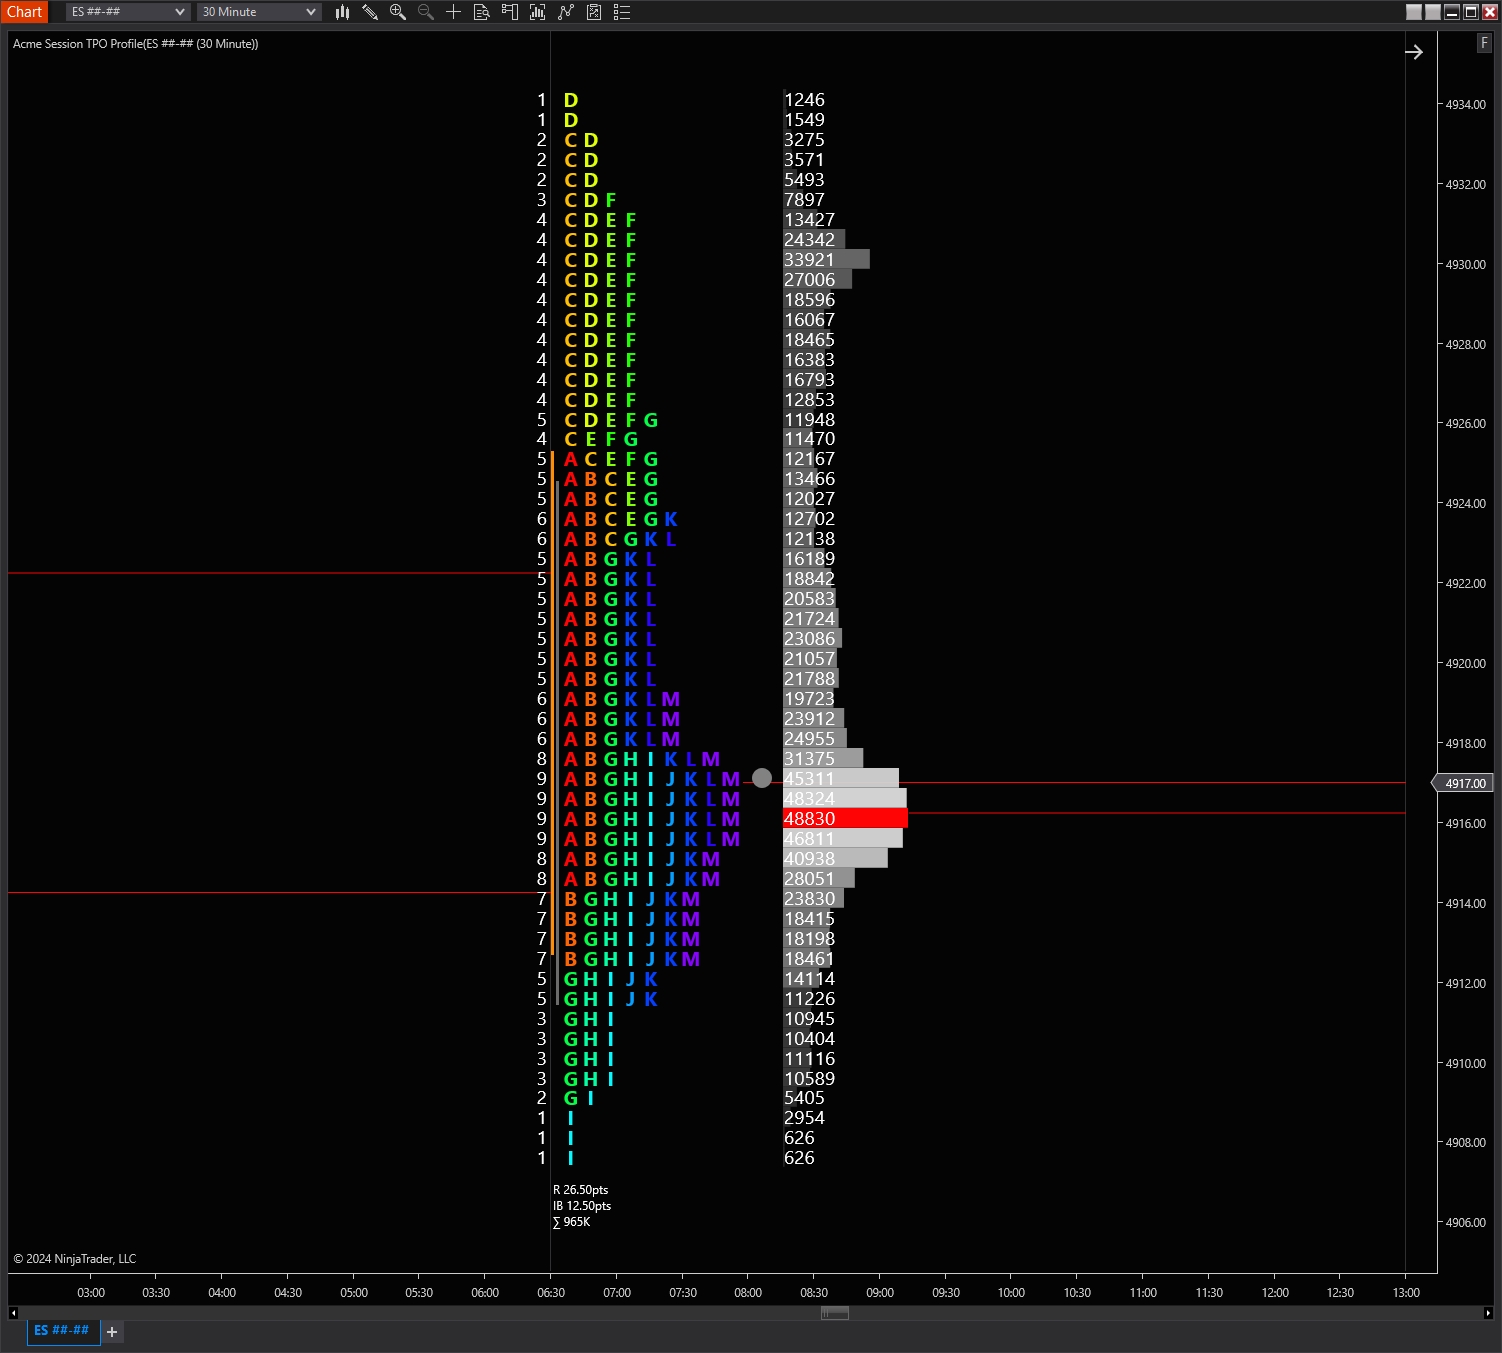
Session TPO Profile
$159.00
Sessions are one of the most critical time frames for any instrument. But why? Even if your favorite instruments’ trades are mostly executed by algorithms, those algos are created and controlled b human beings. As such, humans have a natural rhythm controlled by the need to rest and sleep. So daily sessions are the first significant opportunity for market participants to pause (a forced pause by most exchanges), reflect and adjust. All of which is why sessions are a critical time frame to include in your analysis.
Includes indicator and how-to guide for installation & configuration.
- Description
- Additional information
Description
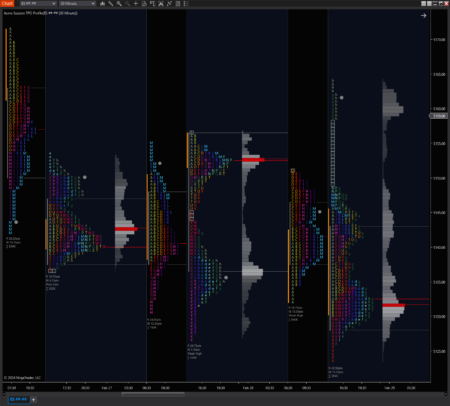
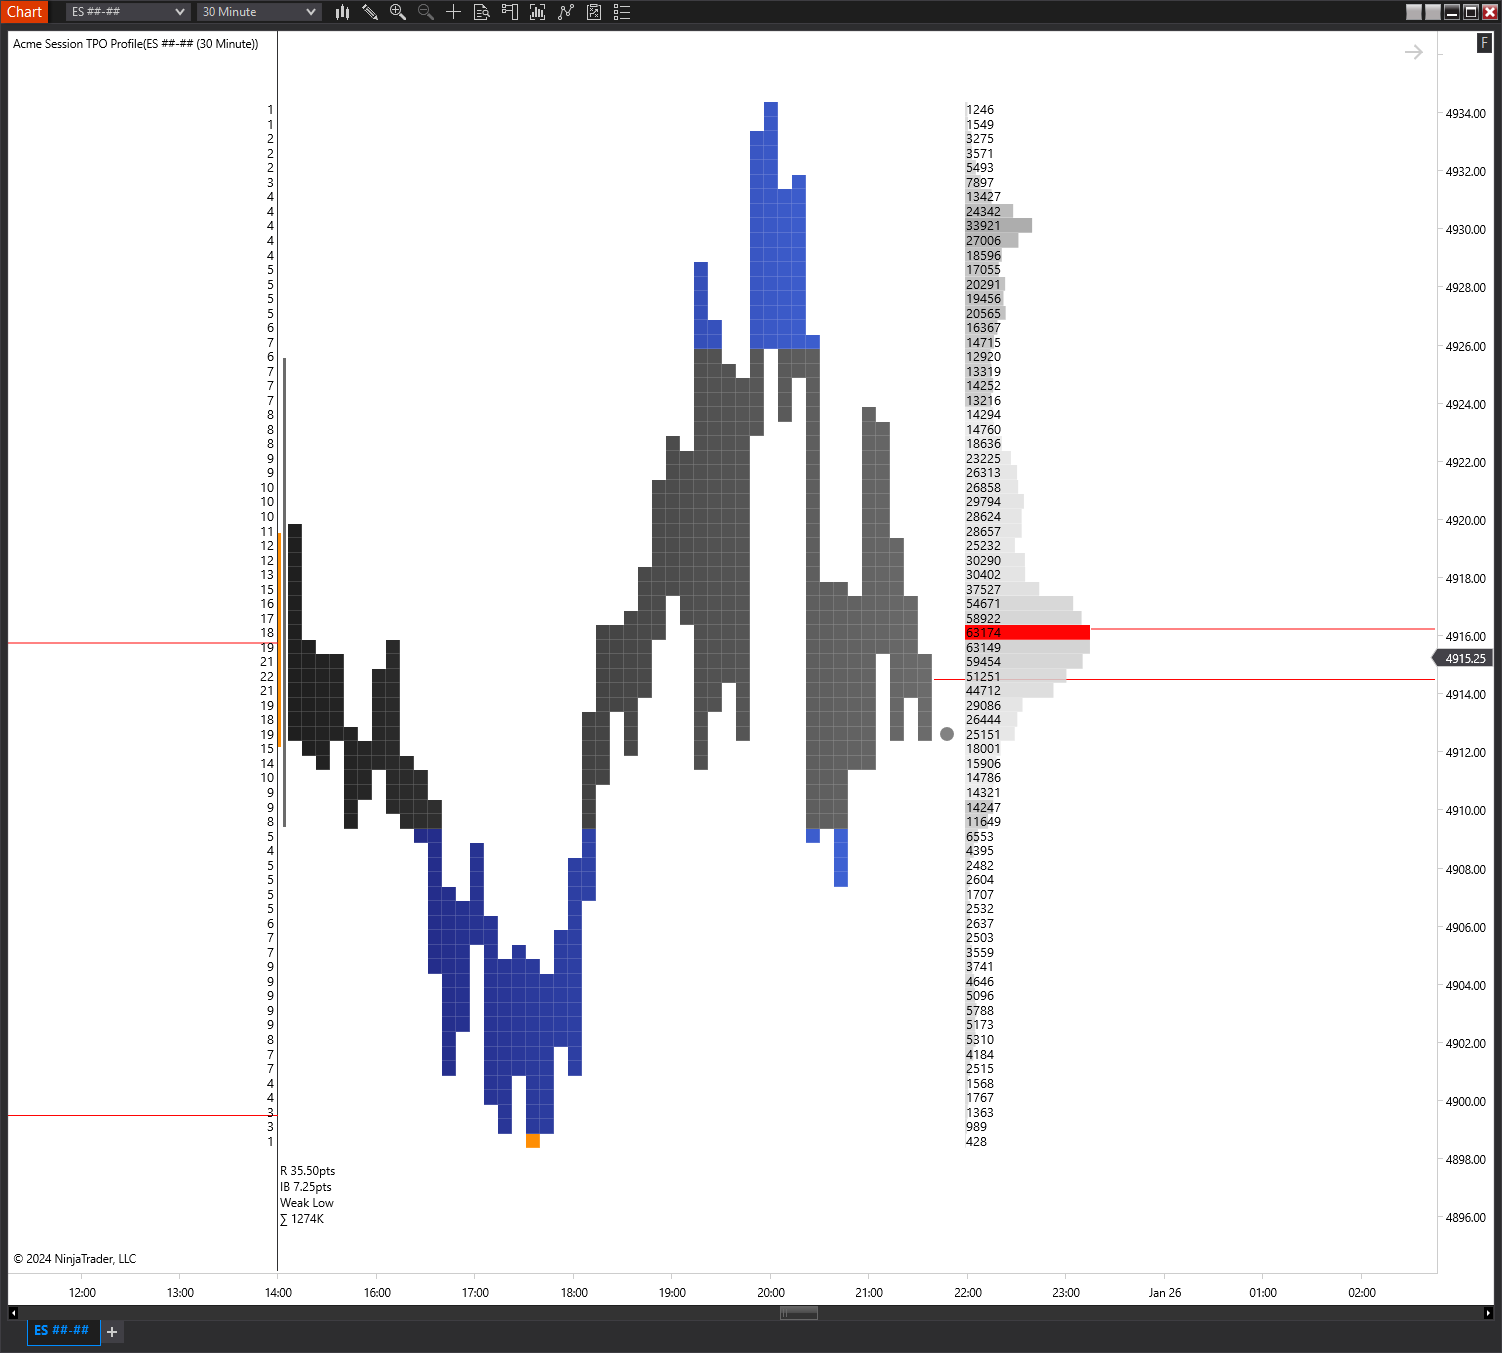
- TPOs are configurable and be displayed on any chart type, including non time-based charts
- Shows critical session levels:
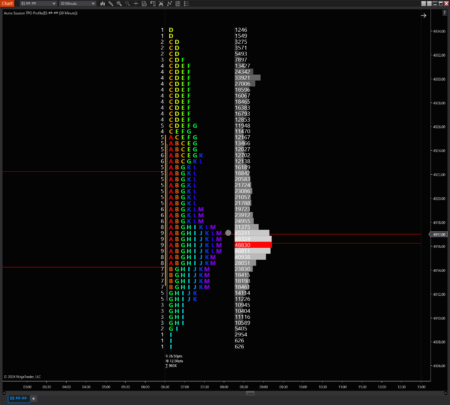
- Point of control
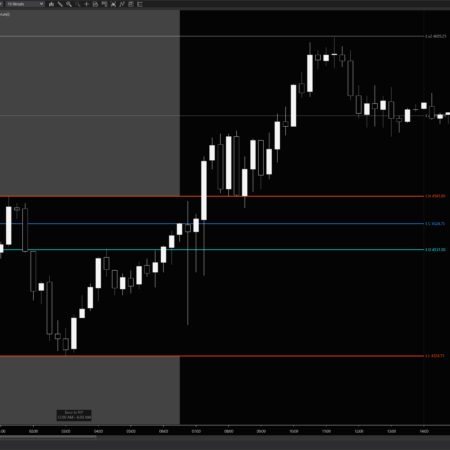
- Initial balance high and low
- Optional IB extensions
- Opening range high and low (in addition to the IB)
- Value area high and low
- High, mid and low price
- Open and close prices
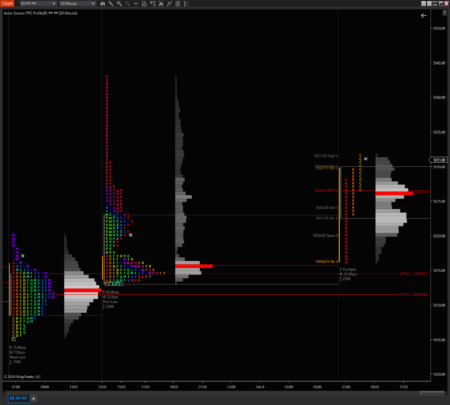
- Previous session high and low
- Previous session value high and low
- Highlights important profile patterns:
- Single prints
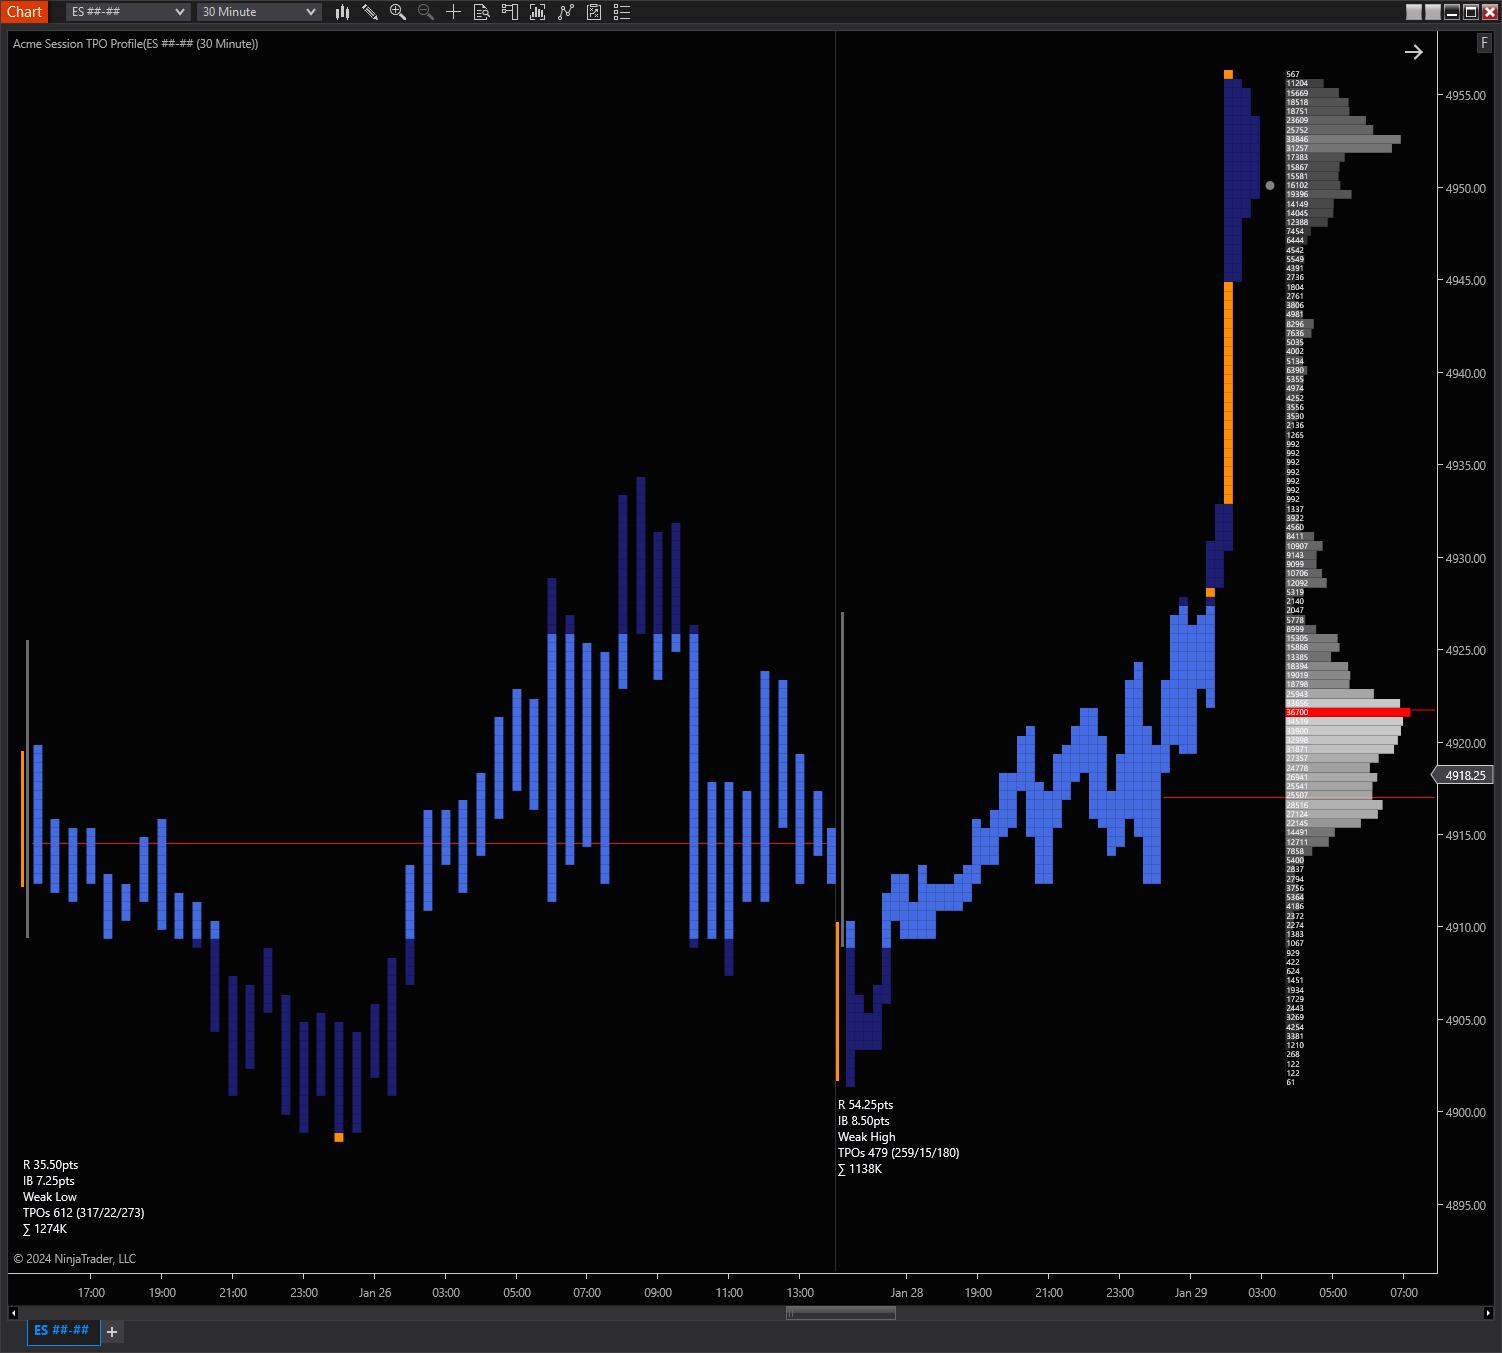
- Weak highs and lows
- Poor highs and lows
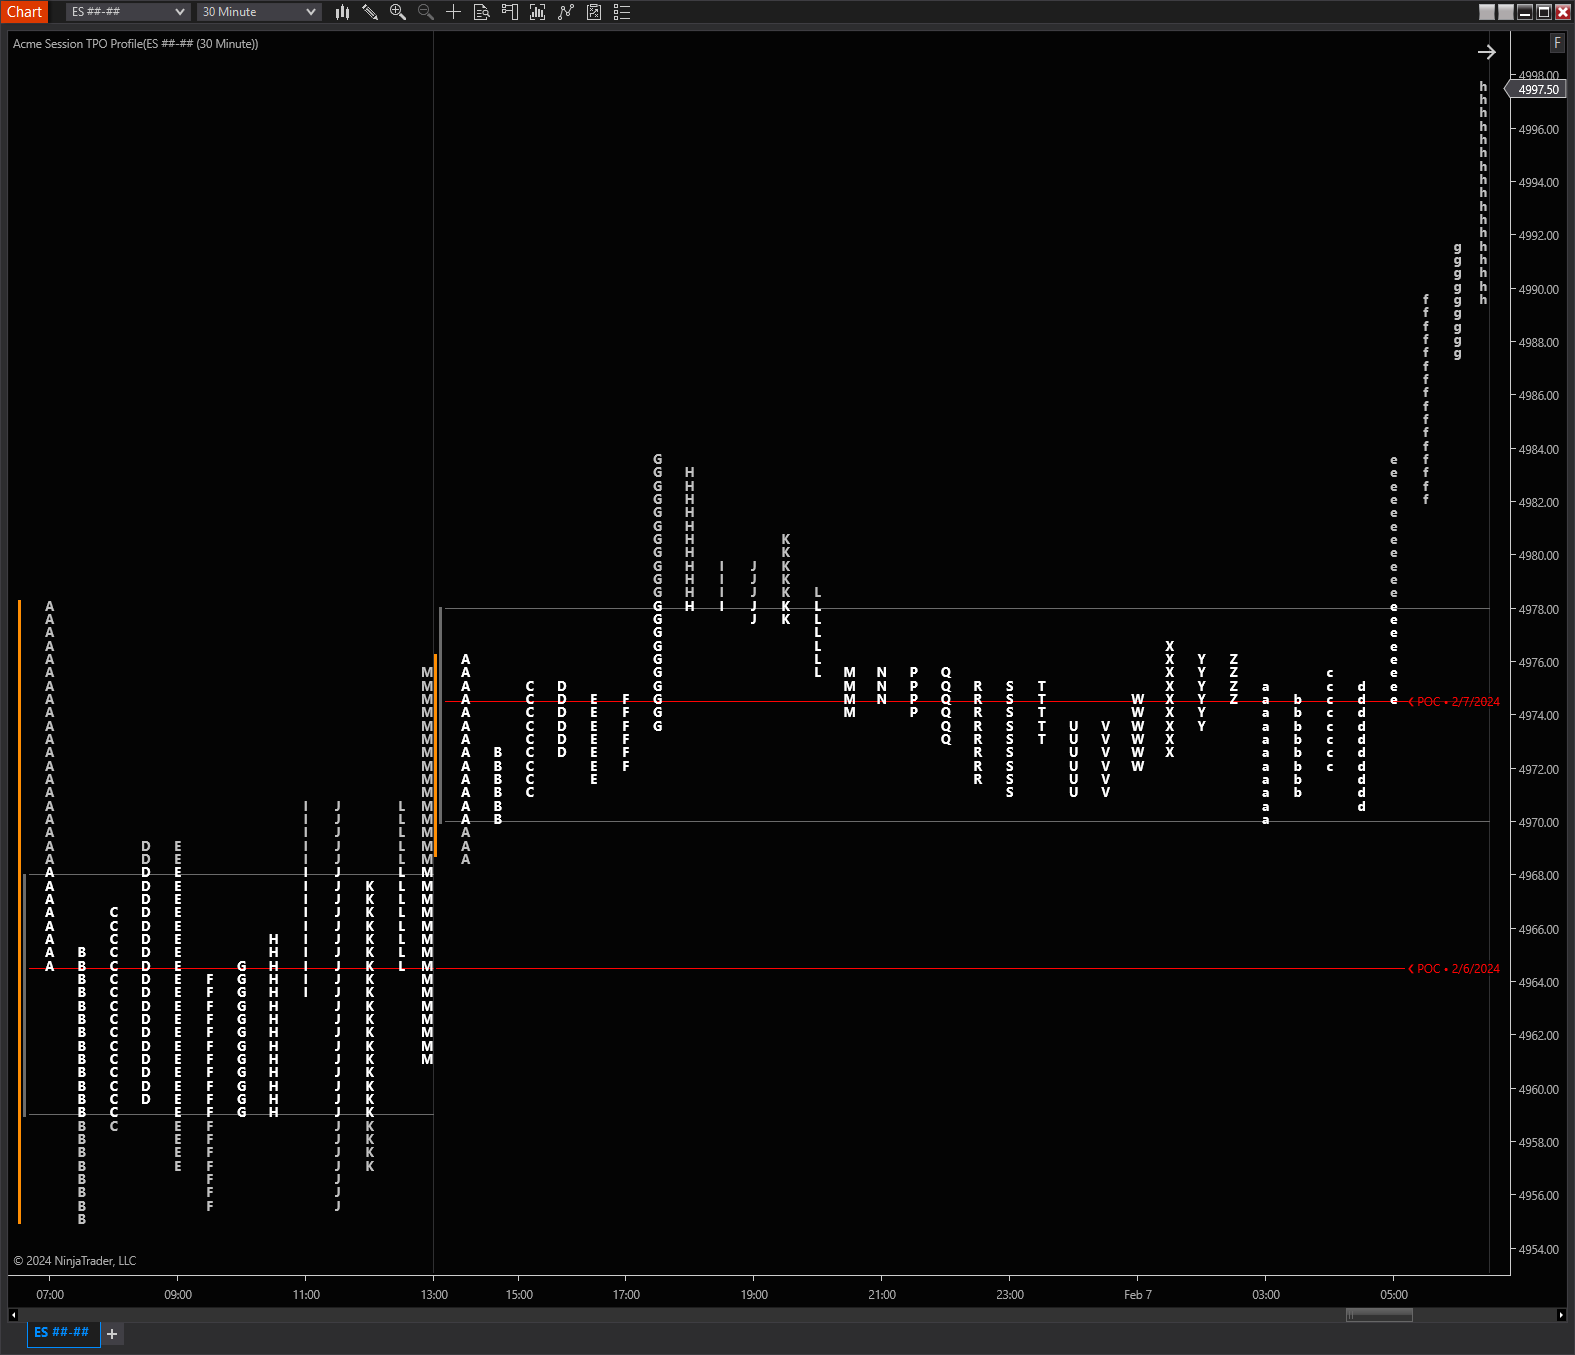
- TPOs can be displayed as letters or blocks in increments of 1 minute or higher
- TPO opening bracket prices can be highlighted
- TPO bracket mid prices can be highlighted
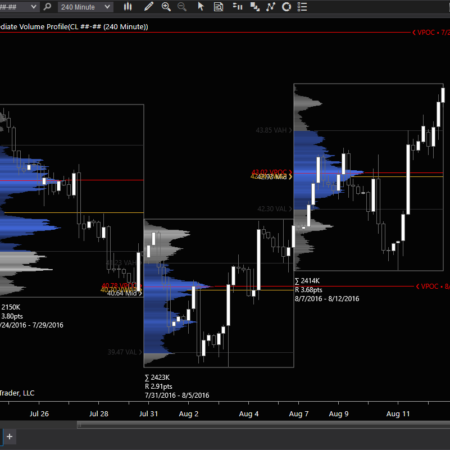
- Displays a configurable value area for both time and volume
- Optionally displays total volume- and TPOs-at-price
- Displays optional, separate volume profile for the current TPO bracket
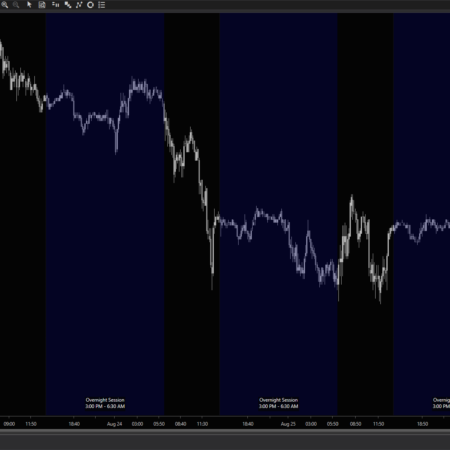
- Independently configurable start letters for ETH and RTH sessions
- Background colors and intensities can be set for ETH sessions for easily distinguishing between ETH and RTH hours
- Displays optional naked POC markers with smart session splitting of ETH and RTH on a single chart
- Displays optional naked value area markers with smart session splitting of ETH and RTH on a single chart
- Volume profiles can display left or right
- Profiles can be merged/unmerged directly on the chart
- Displays TPOs as either profiles or bars, and can be contextually switched between styles on the chart
- Supports a configurable number of prices per TPO, useful for instruments with a small tick size and/or large session range
- TPOs graphics are displayed on regular charts, can be used in conjunction with other indicators and even non time-based bars
Additional information
| Supported Markets | Futures, Stocks & ETFs, Forex |
|---|---|
| Time Frame | Intraday, Day |