Breadth Bars
$59.00
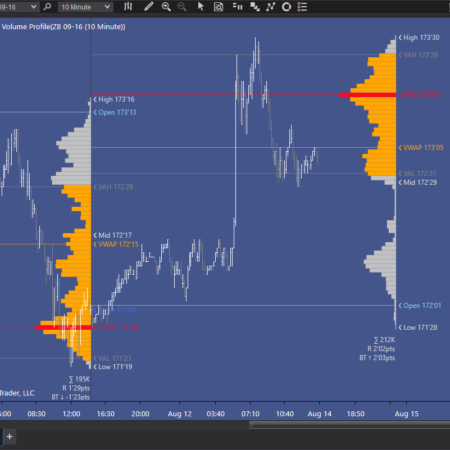
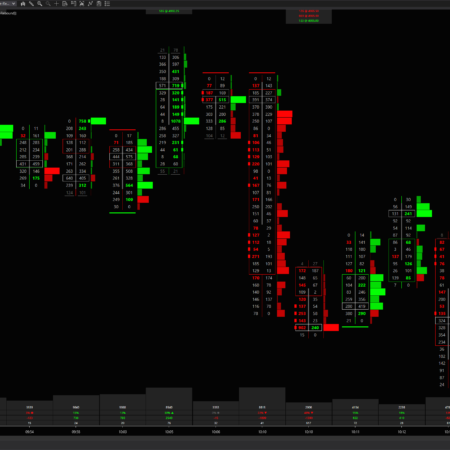
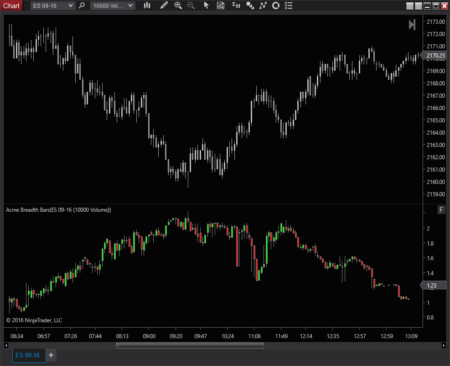
Specially designed for the equity market TICK, TRIN, advance/decline and other ratio- or net zero-based indices, which are real-time measures of how many stocks in that index or exchange are trading on an uptick or down tick (net) at any given moment in time. Each of the major exchanges has at least one of these types if internals.
The breadth bars are very effective for detecting 2 scenarios:
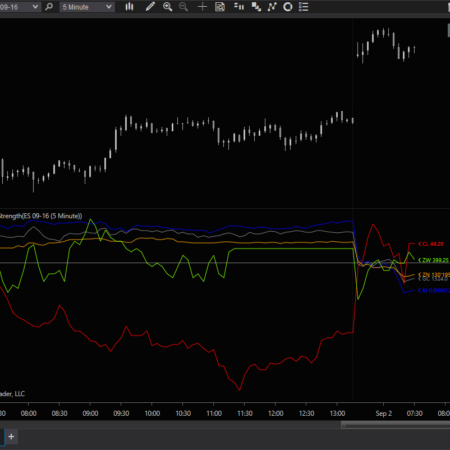
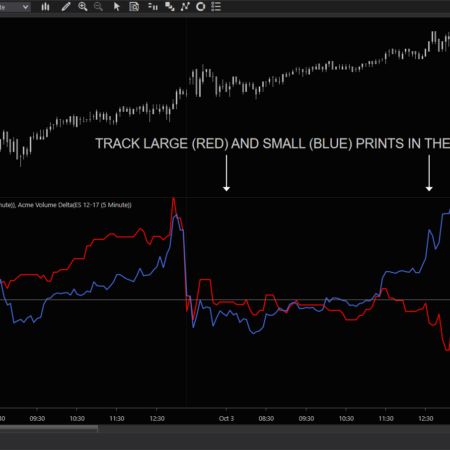
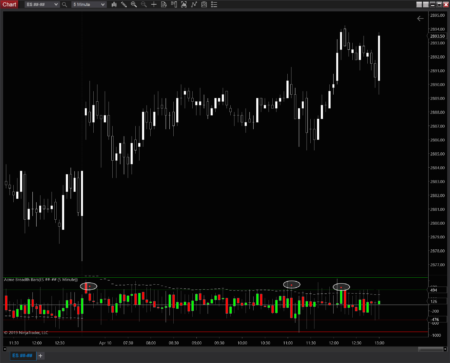
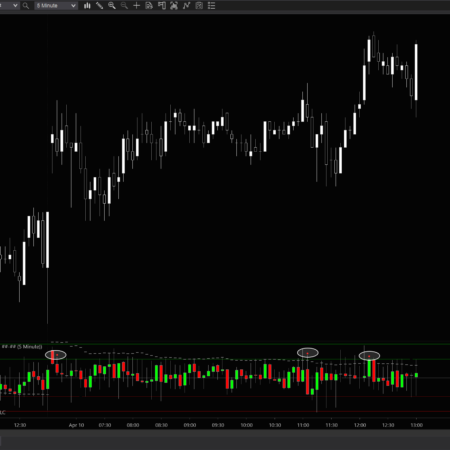
- When a buy or sell program begins churning inventory, it’s very often enough to move a whole index or exchange up or down for a period of time. These institutionally-executed programs leave readily visible tracks on the price action of the day – you just have to look for them. When charting a TICK index, the Breadth Bars indicator shows you the magnitude of this program in real time, and also is one of the clearest ways to see when a buy or sell program is peaking or winding down.
- When an equity index is also on your chart, the Breadth Bars can also reveal divergences at highs or lows. These can appear when a program begins buying or selling, but participants who are trading in the index itself are positioning in the other direction and may become wrong-footed in in the near future.
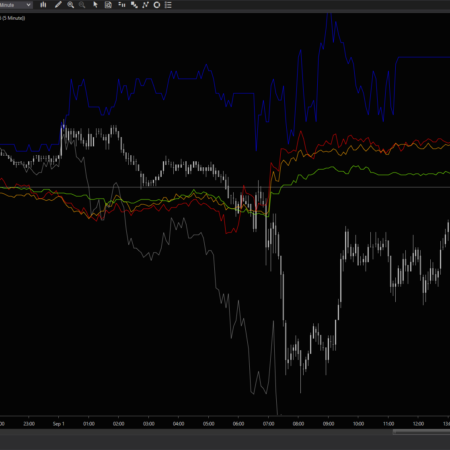
- Shows divergences between bar highs and lows and breadth highs and lows which can precede swings and reversals
Includes indicator and how-to guide for installation & configuration.
- Description
- Additional information
Description
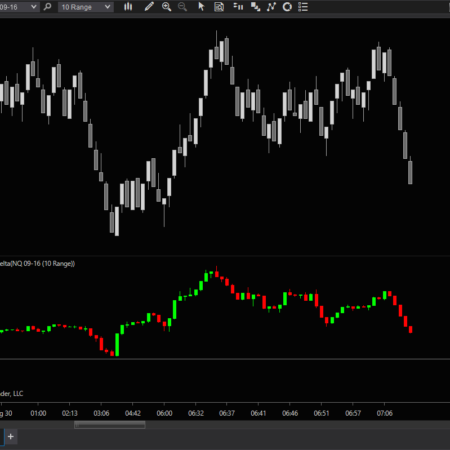
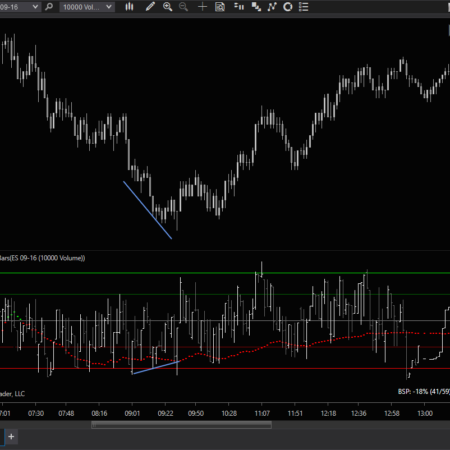
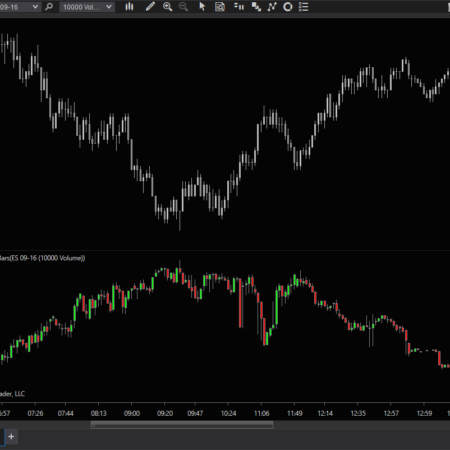
- Creates bars in terms of your charted instrument, even non-time based bars, for faster recognition of divergences
- Provides a total of 4 configurable levels of reference, 2 to the buy side and 2 to the sell side
- Provides a trend line that shows where the pressure is increasing or ebbing, and in which direction with real-time readout of current buy-sell pressure
- Displays both candle and OHLC bars
- Features optional audio alerts for when the tick values breach high or low extreme
- Chart lines drawn on price panel and indicator panel are to illustrate divergences which can appear between TICK indices and price, they aren’t drawn automatically
Additional information
| Supported Markets | Futures, Stocks & ETFs |
|---|---|
| Time Frame | Intraday, Day |