Volume and TPO Essentials
Updated for 2024!
We’ve heard many times that all the acronyms and jargon used by volume profilers is, to the uninitiated, like another language. It can be intimidating because there really is a lot of jargon. Some of that jargon stands on some readily explained but not-so-obvious theory and once you begin to understand what all of it means any feelings of confusion and intimidation evaporate.
In the spirit of lifting that particular fog, below we present our illustrated primer of volume and time profiling analysis concepts and terminology. Which is to say that it’s specifically focused on the Acme-style uses of the terms, liberally infused with editorial comments where they add value, and the examples displayed will be of Acme charts.
One quick note about organization. Rather than an alphabetical listing, the entries below are intentionally ordered from conceptually general to conceptually specific. That way you can read top to bottom, and it may make more sense than skipping all around as you encounter a term or concept with which you’re not familiar. This is by no means exhaustive (it says essentials in the title after all, right?) and we’ll add to it as necessary, so be sure to stop back by from time to time.
How to Read Volume Charts & Profiles
Profiles are histograms of the volume transacted or time spent at each price over a specific span of time such as a day, month, year or even a single bar. The Acme suite has specialized profile types for pretty much any span of time, with special support for the “standard” units of time such as sessions, weeks, quarters and years. Some of the most commonly-used profile types are:

Composite Volume Profile
Typically span several days to a few years and include all volume in the profiled range without respect to session, day or weekly boundaries.

Intermediate Volume Profile
Very similar to composite profiles and used much like composites, they tend to span a few days to a few weeks, and as such their user interface is optimized for this scenario.

Session Volume Profile
A specialized kind of volume profile, and are probably the most-used variety of short term profiles. They are specifically designed to profile a single session (or a single day) and usually include lots of landmark short term levels such as the initial balance, open, previous close, value area, balance targets and more.

Intraday Volume Profile
An ever more specialized type of profile used on very short spans of time such as one or a few bars, or maybe a regular interval of time such as 15 minutes.
How to Read TPO Charts & Profiles
Similar to volume profiles, time-price-opportunity (TPO) profiles are histograms of how much time was spent at each price within the span of the profile rather than volume-at-price. Generally, TPO profiles are less precise than volume profiles over shorter terms like a session. That does not detract from their value, however. TPO profiles be used on their own to find areas of support and resistance, and can also be used in conjunction with volume profiles. Contrary to what many say, we believe them to be complimentary forms of analysis rather than competitors. When time-at-price and volume-at-price agree, this can be a form of confluence. Put simply, confluence is market structure, and market structure is tradeable.
Rather than bars, TPOs are defined as units of time called brackets or periods and the traditional length for one bracket is 30 minutes, though brackets can be any length of time. The shorter the time, the more granular the profiles created. Traditionally, a letter is assigned to each price touched in each period, but TPOs can be represented by other visual glyphs such as square or rectangular blocks. Brackets and other meaningful periods can be colored to make it easy to tell them apart when they are packed into a profile.
TPO profiles, because of their simplicity, are especially good at revealing specific kinds of patterns, such as:
- Weak and poor highs or lows. These are upper and lower edges of profiles that appear very blunt and contain multiple TPOs at or near the edge. This is an indication that buyers or sellers were not provoked to respond at the range edge and it is likely that further range expansion’ll occur.
- Single prints. Often just called “singles” TPO single prints occur in the middle of a profile (not at the upper or lower edge) and are created by an impulsive move and have potential to be revisited in the near future. If the single prints are not revisited soon after they are made, then they should be considered a boundary between auction/balance zones.
It’s typical to see TPOs in either profile form or expanded into bars where the prices touched in each time bracket is represented much like a bar chart, sans the bars. Examples below:

Session TPO Profiles

Intermediate TPO Profiles
POC & VPOC
The point of control (POC) and volume point of control (VPOC) are sibling terms used in TPO and volume analysis, respectively. In TPO profiles, the POC is the price at which the most time was spent over the course of the profiled range – usually the price closest to the profile midpoint if there is more than one price at which the same amount of time was spent. Likewise, for a volume profile the VPOC (usually pronounced vee-pock) is the price at which the most volume was transacted.
Even though there is a difference of one letter, the thing they are both trying to gauge is the most accepted price in a given period of time. That is, the price at which most buyers and most sellers were in agreement over “fairest value.” The concept of “fairest value” is really important – the VPOC and POC are not just the peaks of chubby profile bellies (or, er, “headlights” if higher up). The POC/VPOC is the price the market thought was the most fair, based on currently known information.
Think about that for a second. That means there’s nothing magic about the POC or the VPOC. They are simply the “most fair” price for a given range of bars. (V)POCs are based on what the market participants actually did, and not a complex or predictive mathematical formula. Many people ask us how the VPOC or POC is calculated when, interestingly, it’s not calculated at all. It’s accumulated, then because of what it means it’s given a special color. Have a look at an example of both techniques on the same instrument, bars and sessions:

Time POC

Volume POC (VPOC)
Initial Balance
The initial balance (IB) is traditionally the range of prices transacted in the first hour of trade. Many regard the IB as a significant range because, especially for the index futures which are tied to the underlying stocks, orders entered overnight or before the open are typically executed prior to the end of the first hour of trade. Some use it to try to understand how the rest of the day may develop, while others use it as a span of time to avoid trading altogether because of its potential for volatility.
While the IB, sometimes also called the opening range, is typically used as reference levels during the session by both volume and TPO profilers. While 60 minutes is the traditional IB duration, it can be longer or shorter depending on your instrument and session definition. In addition to the IB high (IBH) and IB low (IBL), many profilers regard initial balance extensions as reference levels – what we here at the Ranch call landmarks. Each extension represents 50% of the IB range, and can be useful reference points on days where there is range extension trade. The further away the extension from the IB range, the less likely price is to get there. Want to know how much less likely? Have a look at this market study.

Initial Balance with Rejections
Opening & Closing Prices
The open price is the first price of the session, the close is the last price of the session. While not really specific to volume and TPO profiling, they are critical price landmarks. For example, during an RTH session (see below), when price drops below the opening price it may be ill-advised to initiate new longs as this can be considered weakness – a lack of interest from buyers or overpowering interest on the part of sellers. Conversely, the closing price is important because in many instruments recent closing prices are frequently revisited, or tested, in subsequent sessions to see if buyers or sellers are still present and motivated to take action. More on this later in the naked price definition.
Naked Prices
So-called naked prices are ones that have a propensity for being revisited or tested in subsequent sessions. It’s pretty widely known among both TPO and volume profilers that past POCs, VPOCs and recent closing prices are common targets for re-testing and revisiting. In fact, there are many traders who have special setups just for these prices. So these special prices that have yet to be re-tested are called naked or virgin. Forgive the obvious innuendo. We didn’t make this up. ;-} But it sure sticks in the mind, no?
Let’s look at so-called open gaps. The difference between a session’s opening price and a previous session’s closing price is called a gap. Gap closures are where the distance between the current open and a previous close is, well, closed. Half-gaps are, as the name implies, is 50% of an open-to-previous-close distance. The more recent the open gap, the more magnetic it can be.
And so it is also with naked VPOCs. They are common targets for closure in the same manner as gaps – sometimes even when they are months or years old (one example of why we refer to them as landmarks… they tend to endure).
Once the gap or VPOC is touched in a subsequent session, it’s no longer naked or virgin and therefore loses a great deal of magnetic appeal. OK, stop giggling out there. Yes, we mean you. ;-}
Here’s an example:

Naked Gaps and VPOCs
Value Areas
Of all TPO and volume profiling concepts, the value area has to be a top contender for the title most widely used but least well understood. It uses standard deviations, a basic statistical measurement device, to identify the range of most-accepted prices. Here’s where it’s important to editorialize… the value area should be used more as a guideline than a rule.
Why? 2 reasons. How the standard deviation is used in calculation of a value areas is not really the same as it’s used in straight-up statistical analysis. More on that below. Next, there are several ways to calculate a value area, each subtly different but none of them “right” and none of them “wrong.” Follow along, you’ll see what we mean.
Let’s take the first reason, well, first. In statistics, the standard deviation is a method for calculating how much of a normal distribution can be expected to be included at a specific distance from the distribution’s mean (aka the average). One standard deviation, when applied to a normal distribution, will include 68.2% of that distribution. That’s 34.1% on each side of the mean:
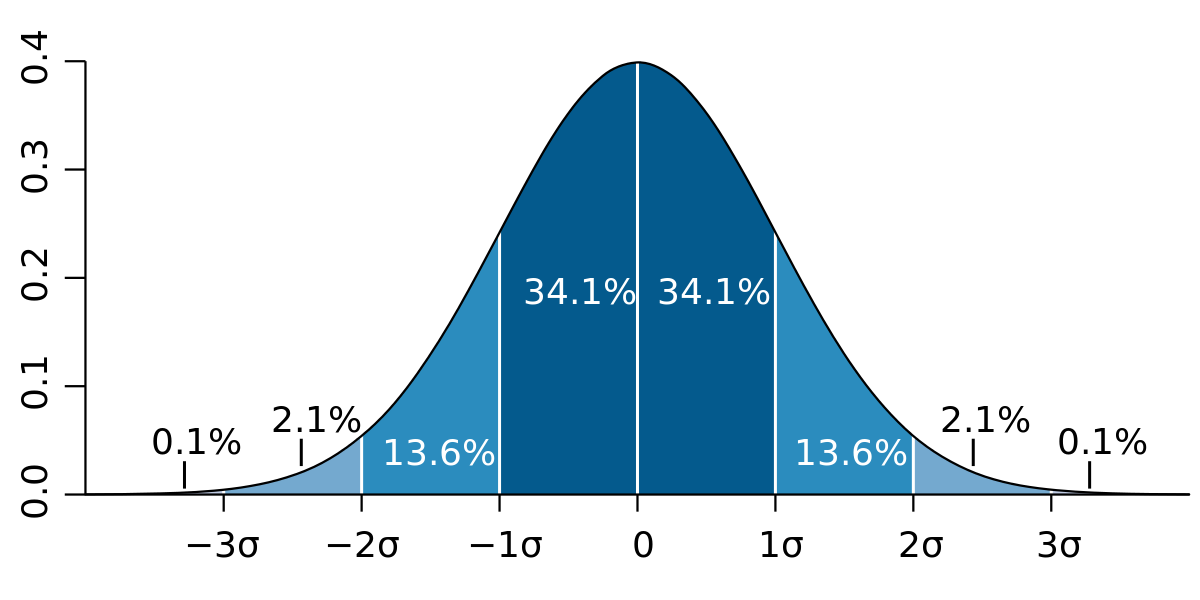
Now you’re probably saying to yourself “hey! that looks like a volume profile!” And it does, for the most part. Except that it’s only the exceptional volume profile that could be classified as a normal distribution (“normal” in this case is a type of distribution, not a value judgement). And there is a name for that rare-ish breed, as we’ll see below. Most volume and TPO profiles are anything but normal. They frequently have multiple peaks and valleys, are nowhere near symmetrical and the mean is often not in the center.
Below are some more key differences:
- Rather than using the distribution’s mean, or average price, volume and TPO value areas use the POC or the VPOC (which is actually the mode and not the mean) as the origin of the value area. If the POC or VPOC is skewed far to one side of the profile/distribution, that still counts as the mean. As a result, in such profiles the value area will also weighted to the side of the profile containing the VPOC or POC.
- Rather than having equal amounts on either side of the distribution, value areas can be pretty lop-sided in the number of prices above and below the POC/VPOC/origin.
- Value area widths are user-configurable in many products. In normal distributions, one standard deviation is a specific, known amount. It includes just under 70% of the most-frequently occurring values in the distribution. Again, in many products – Acme included – users can redefine the width of the value area. Which is something to keep in mind when making cross-product comparisons – make sure the value area widths are equal.
- Most value area calculations have several special, traditional rules that have nothing to do with the mathematical definition of the standard deviation. For example, in TPO profile implementations, when there are multiple prices which have the highest number of TPOs in them, the price closest to the middle of the distribution is counted as the POC. Thus, the origin of the value area will be there. Additionally, most value area implementations favor prices on either side of the (V)POC that have the most volume or TPOs, which often makes them asymmetrical. Some examples of skewed VPOCs and asymmetrical value areas:

Asymmetric Value Areas
So you see, value areas are not really what you might call examples of mathematical precision and simplicity, unlike the strictly-defined standard deviation. This does not mean value areas are not useful – they very much are. But they can vary a bit from product to product and even data feed to data feed, and this is normal. As we said above – value areas should be considered more of a guideline than a rule. Lastly, it’s worth noting that certain instruments “respect” value and value areas more than others.
Balance Areas & Balanced Profiles
Areas of balance are those “exceptional” profiles, or parts of a profile, mentioned above. They are characterized by an overall resemblance to a normal distribution. That is to say, most notably, a nice fat middle with gently reducing extremes and readily apparent symmetry.
Balance areas are important because they display areas where buyers and sellers came together and agreed on “fairest value.” When you see balanced profile, you want to look at two things: range and volume (or depth of TPOs). Generally speaking, balanced profiles may convey one of two important pieces of information, when compared to other profiles of the same instrument and period:
- Small range, high-volume/TPO balance areas and profiles tend to signify that there was a significant but roughly equal clash of buyers and sellers at a given range of prices. You can expect that a breakout of the balance range will occur… eventually. These kinds of balance areas signify that a war is raging under the surface, and the loser will probably be the side that runs out of ammunition first.
- Small range, low-volume/TPO balance areas and profiles tend to mean that the market is in no hurry to go anywhere and is waiting for new information. These kinds of profiles are often seen when significant economic news is expected but not generally known. Simply put, there’s no real motivation for acting on the part of buyers or sellers, so price flops and chops around a small range until that new information is known and motivates a revaluation of a market.
What’s most important about the concept of profile balance is that it’s a clue that a market has done its job and a cycle has ended, a fair price been achieved. And… now the market’s cycle needs to start anew and attract buyers and sellers with new prices. In other words, once a market reaches balance, time adds new information that must be repriced. Balance time is also, ironically, go time.
Some examples:

Balanced Time + Volume Profiles
High Volume Areas/Nodes
HVAs or HVNs, as they are often called, are really nothing more than balance areas. So now that we know what they look like, let’s touch briefly on what they mean for the auction and price action. In general, high-volume areas are ranges of accepted prices – prices that were deemed “fair” by the market and where aggressive action was not called for. In addition, HVAs can signal other things too, depending the time frame on which you’re looking at them.
In the short term, HVAs are areas where price can be expected to move slowly, flopping and chopping around, because of the lack of impetus for action on the part of market participants. In the longer term, HVAs can be viewed as safe areas to which price tends to retreat when it’s in discovery mode. Follow along in the example below:

High Volume Areas
Low Volume Areas/Nodes
In contrast to HVAs, LVAs or LVNs are considered “unfair” prices in auction theory terms. These are prices which generally spur market participants into action – often aggressively. LVAs are formed simply because they are prices that have never (or barely) been seen before, or they are prices that have not seen much time or volume because participants took swift action there in the past. Markets are always seeking equilibrium between buyers and sellers. That is, essentially, they are always trying to form HVAs and balance areas. So, as the name implies, LVAs are prices where the auction has come moved away from some previous area of balance (a.k.a. acceptance, fair value), because participants took some decisive action.
If you think about it from the detached perspective of Mr. Market – this makes a lot of objective sense. If you’re a participant, not detached but engaged, it also makes sense but the motivations are different. For example, if buyers view a price as unfairly low or sellers as unfairly high, they are going to to buy or sell until price moves to a level where:
- buyers become unwilling to buy
- buyers run out of buying power
- sellers become unwilling to sell
- sellers run out of inventory to sell
Regardless of what side of the trade you’re on, once one or a combination of the above conditions occur the market achieves balance once again. And so the balance/imbalance/re-balance cycle is complete and will inevitably start anew.
LVAs also exhibit another important characteristic, one that dovetails beautifully with the HVA concept above. Once prior HVAs have been re-tested and rejected, the LVAs in between often become a vacuum for price. That is, prices tends to become attracted to LVAs that are sandwiched between HVAs, and often what was an LVA becomes a new balance area. Conversely, what was recently an HVA will often become an LVA at a later time.
This LVA to HVA back to LVA cycle is not a perfect process, it’s a tendency. It does not always happen, but it frequently happens, regardless of instrument. Learning to read and interpret profiles in this manner can help you understand the possibilities of what could come next for price. Some examples below on the weekly time frame:

Low Volume Areas
RTH, ETH and O/N Sessions
Many instruments, especially the futures, have a cash/pit session where both electronic and human-initiated, open outcry trade takes place. The pit or cash hours are called the real-time hours (RTH). The after-hours session, where only electronic trading takes place, is called the extended trading hours, or ETH for short. The ETH session – the time between the close of one RTH session and the open of the next RTH session – is also often referred to as the overnight session. It’s often abbreviated as O/N or with just the letters ON.
All this session-specific terminology is relative to the location of the exchange, which is good to keep in mind if you’re in a time zone that is far away from your instrument’s physical exchange.
Volume Deltas
Volume deltas are used in indicators such as the Acme Volume Balance, Volume Breakdown and Volume Impression in order to gauge real-time buying and selling pressure. Basically, a volume delta is the difference between the total volume attributed as buying minus the total volume attributed as selling for a given period of time. Positive numbers indicate more buying volume than selling volume, negative numbers indicate more selling than buying. Some examples can be found here and here.
One of the most common (and best?) uses of volume deltas is to aid in visualizing real-time reaction when prices reach or near important price levels. Volume deltas can be used by themselves, but when coupled with volume and TPO profiling we think each compliments, reinforces and amplifies the strengths of the other. How so? Profiling is all about what has happened, and order flow analysis (volume deltas) are all about what’s happening right now. Only when considered together can the auction story be understood as it’s unfolding.
Market Profile® is a registered trademark of the CME Group. The use of that trademark on this site appears in an editorial context and no infringement of copyright or trademark is intended.