Volume Delta
$69.00
The tick and order flow analysis are at the heart of what we do, which makes this tool an indispensable component of the Acme suite. Volume reveals sentiment expressed in price and commitment to positions. Deltas in particular can also reveal “hidden” disagreements among market participants and may signal a reversal at a key level is imminent. If you are ready to integrate real-time tick analysis into your trading technique, the Volume Delta is the best way to start.
Includes indicator and how-to guide for installation & configuration.
- Description
- Additional information
Description
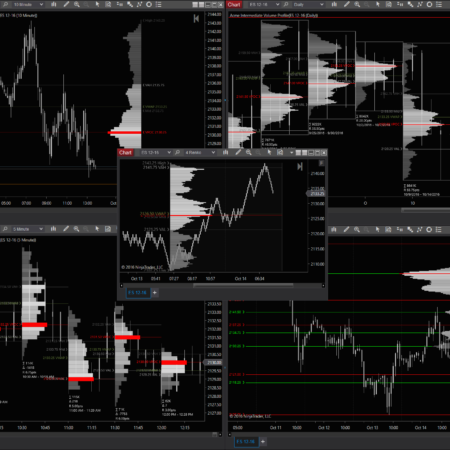
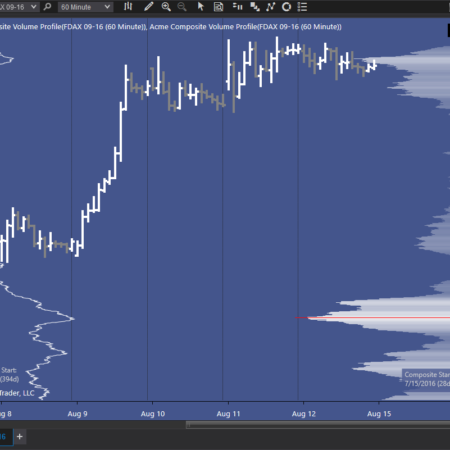
- The Acme Volume Delta features multiple display types:
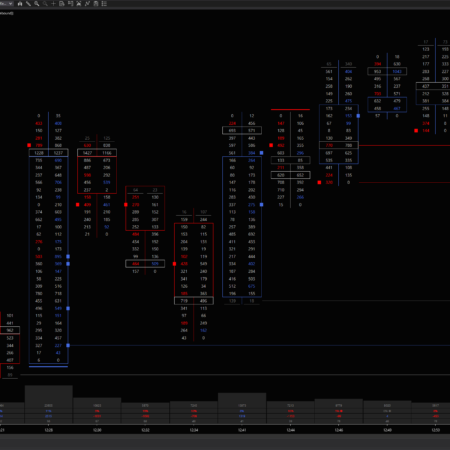
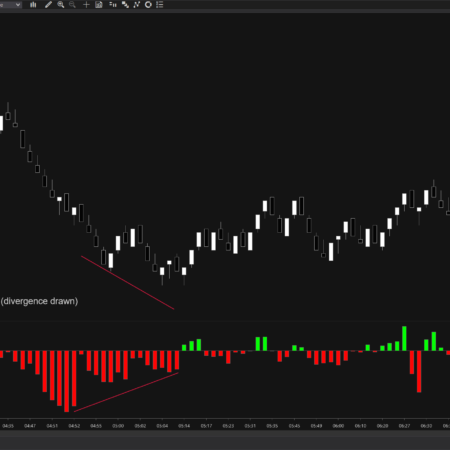
- Cumulative Delta » this style accumulates the buying and selling as a succession of candles, each one opening where the previous one closed, exactly like a series of prices bars. In many instruments, when the shape of the cumulative delta does not match the shape of price (a divergence), this can signal traders acting aggressively to reverse or continue price direction
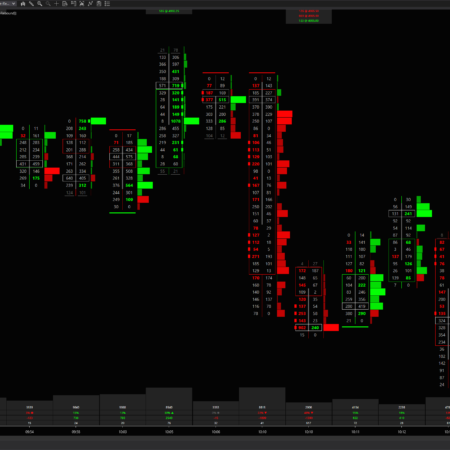
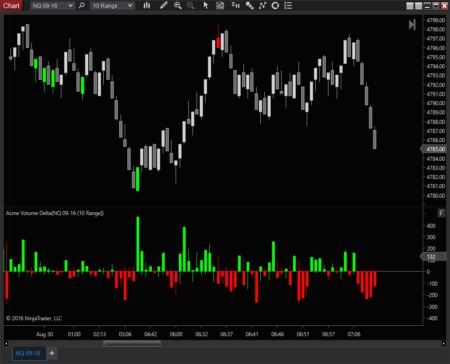
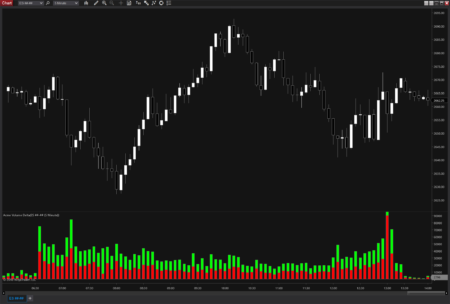
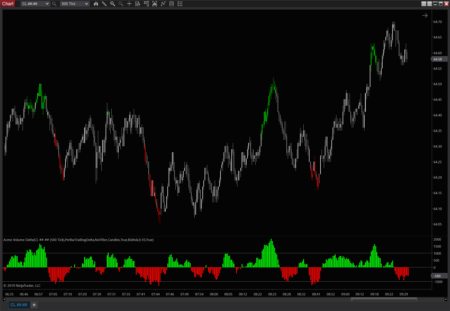
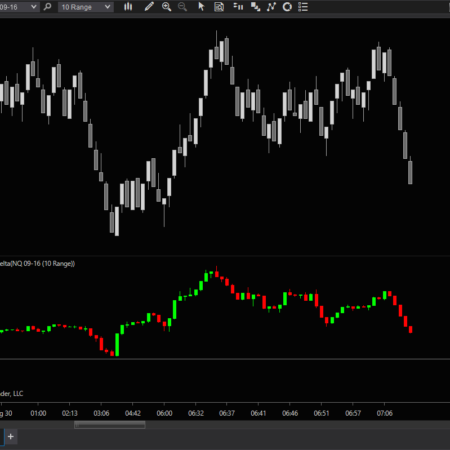
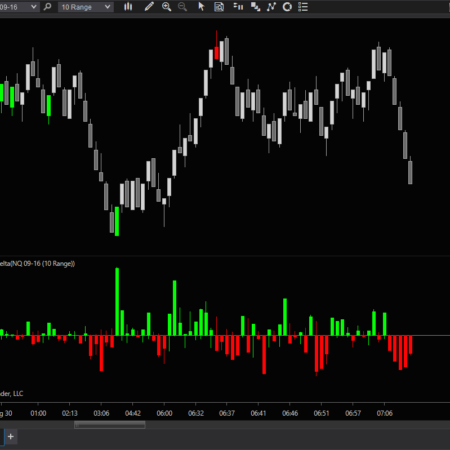
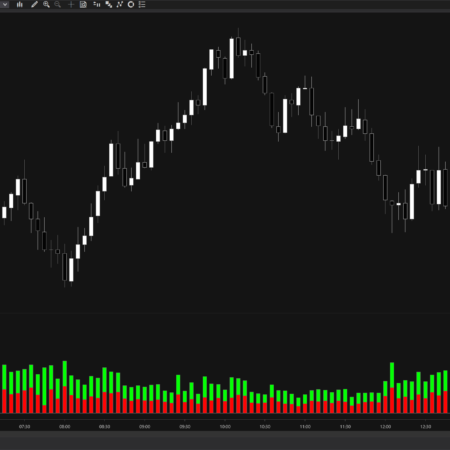
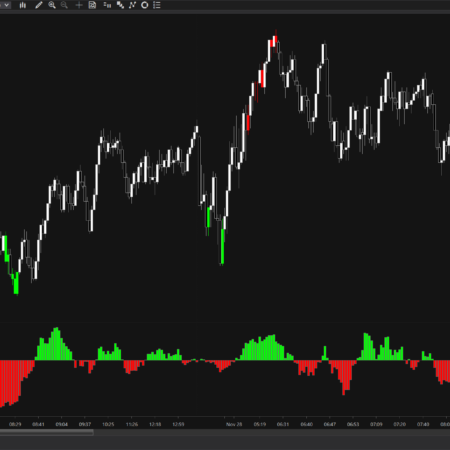
- Per-Bar Delta » a traditional but extremely valuable type, this shows the difference between buying and selling for each bar in absolute contracts or shares, and captures magnitude information
- Per-Bar Ratio » a style of delta which takes magnitude of volume out of the equation, and makes comparison across time. Many instruments have highly variable volume levels at different times of day. Since small ratio values show absorption (balance) and large ratio values show aggression (imbalance), ratios can be directly compared at different levels of total volume
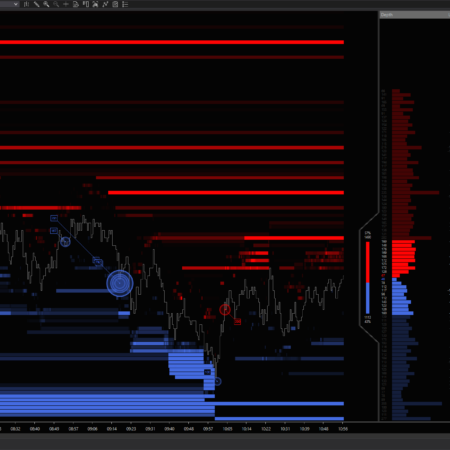
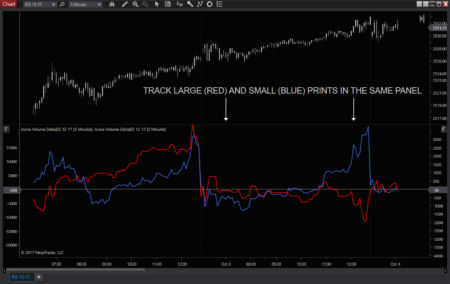
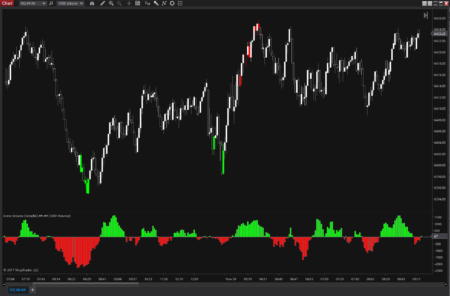
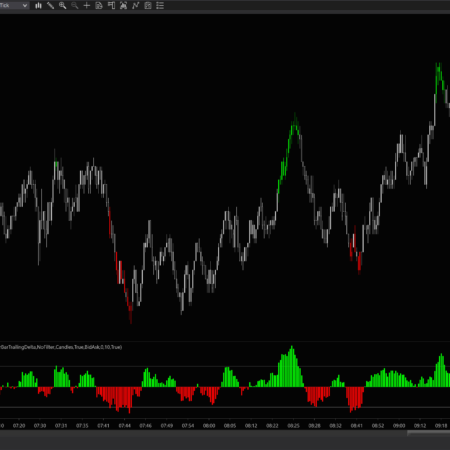
- Per-Bar Trailing Delta » a style which creates a short-term cumulative delta of the last “X” number of bars. This style is very useful on short time frames and can clearly show buying and selling waxing and waning on a per-swing/rotation basis. Features bar coloration when configurable extremes are exceeded (see images)
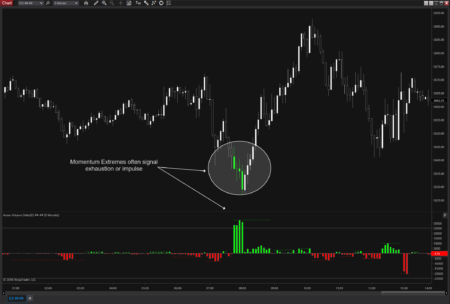
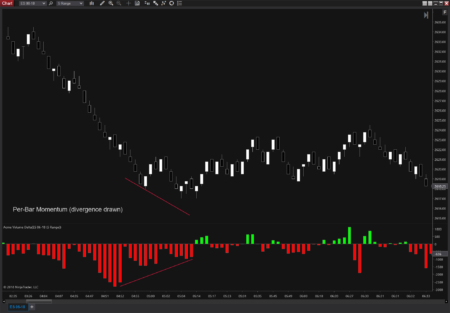
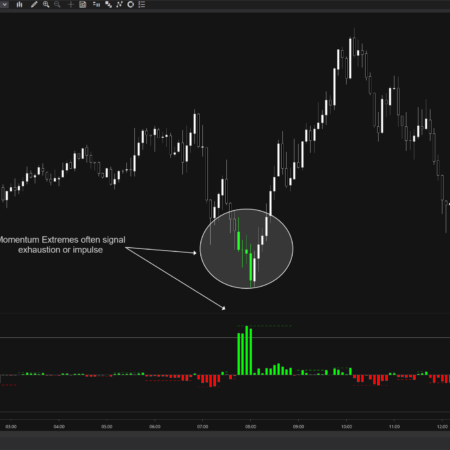
- Per Bar Momentum » a style that accumulates the delta as long as the price bars continue in a specific direction. Very useful for determining when a swing or trend is gaining, maintaining or losing directional participation and for signalling exhaustion at bottoms/tops or impulses which lead to breakouts
- Any of the display types can be calculated and displayed using up/downtick, bid/ask and hybrid evaluation strategies. Up/downtick is useful for all instruments, though it’s the only choice for those without market depth information, such as spot currency crosses. The hybrid strategy can be used by those whose data providers don’t supply historical bid and ask data
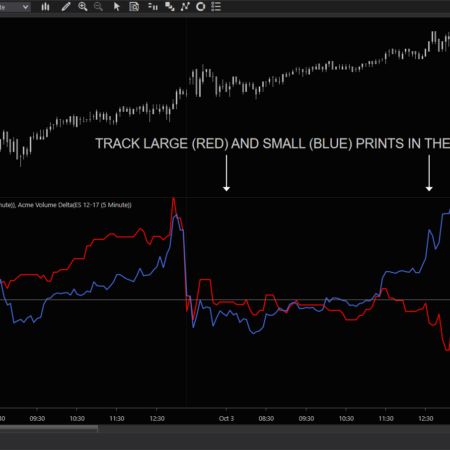
- Advanced volume filtering – include prints above or below a given size
- Cumulative deltas can be displayed in several styles:
- Candlesticks
- OHLC bars
- As a histogram
- As a line (handy for layering multiple cumulative deltas in different print size ranges)
- Per-bar deltas can be displayed in several styles:
- A single bar delta
- As a dual histogram of buying vs selling volume
- As a single bar proportionally colored by buying and selling volume
- Exposes 4 data series which can be used in custom strategies:
- delta
- buys
- sells
- max momentum
- The per-bar delta styles also have optional, automatic divergence markers and audio alerts at new session highs and lows, which often signal intraday turning points
- Can be used in custom strategies
Additional information
| Supported Markets | Futures, Stocks & ETFs, Forex |
|---|---|
| Time Frame | Intraday, Day |