

Flodometer
$149.00
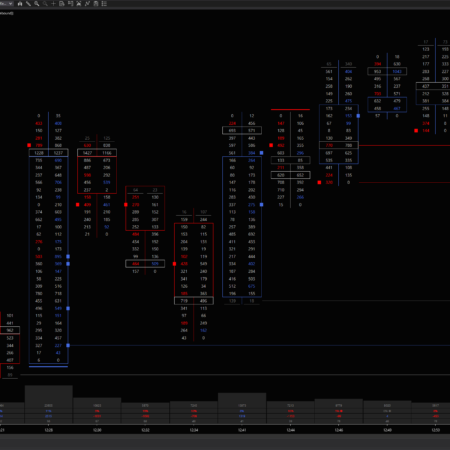
A real time display of:
- the current market depth (aka Level 2) order book liquidity
- a historical view of available liquidity
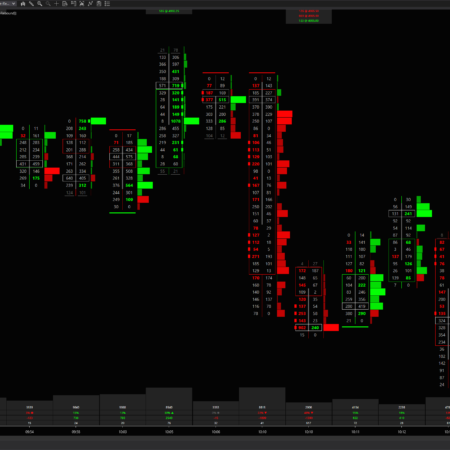
- significant liquidity-reducing transactions (large volume prints)
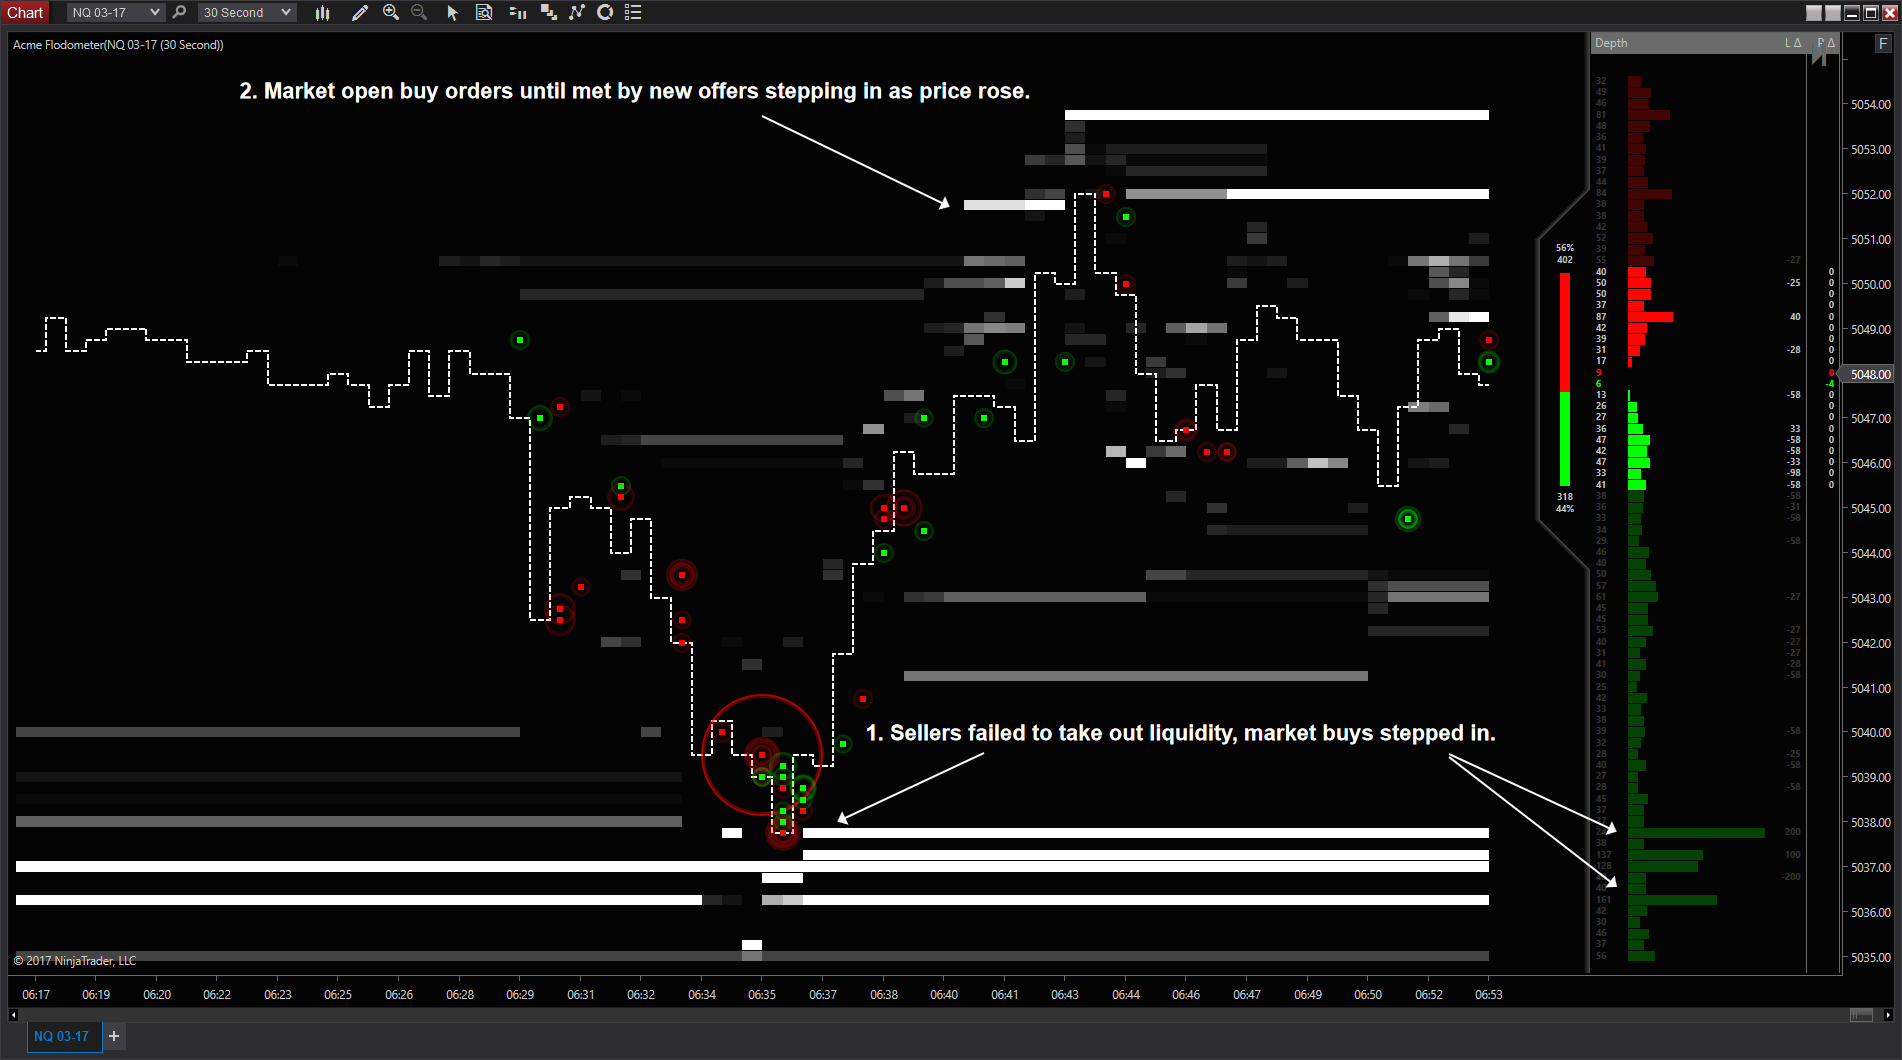
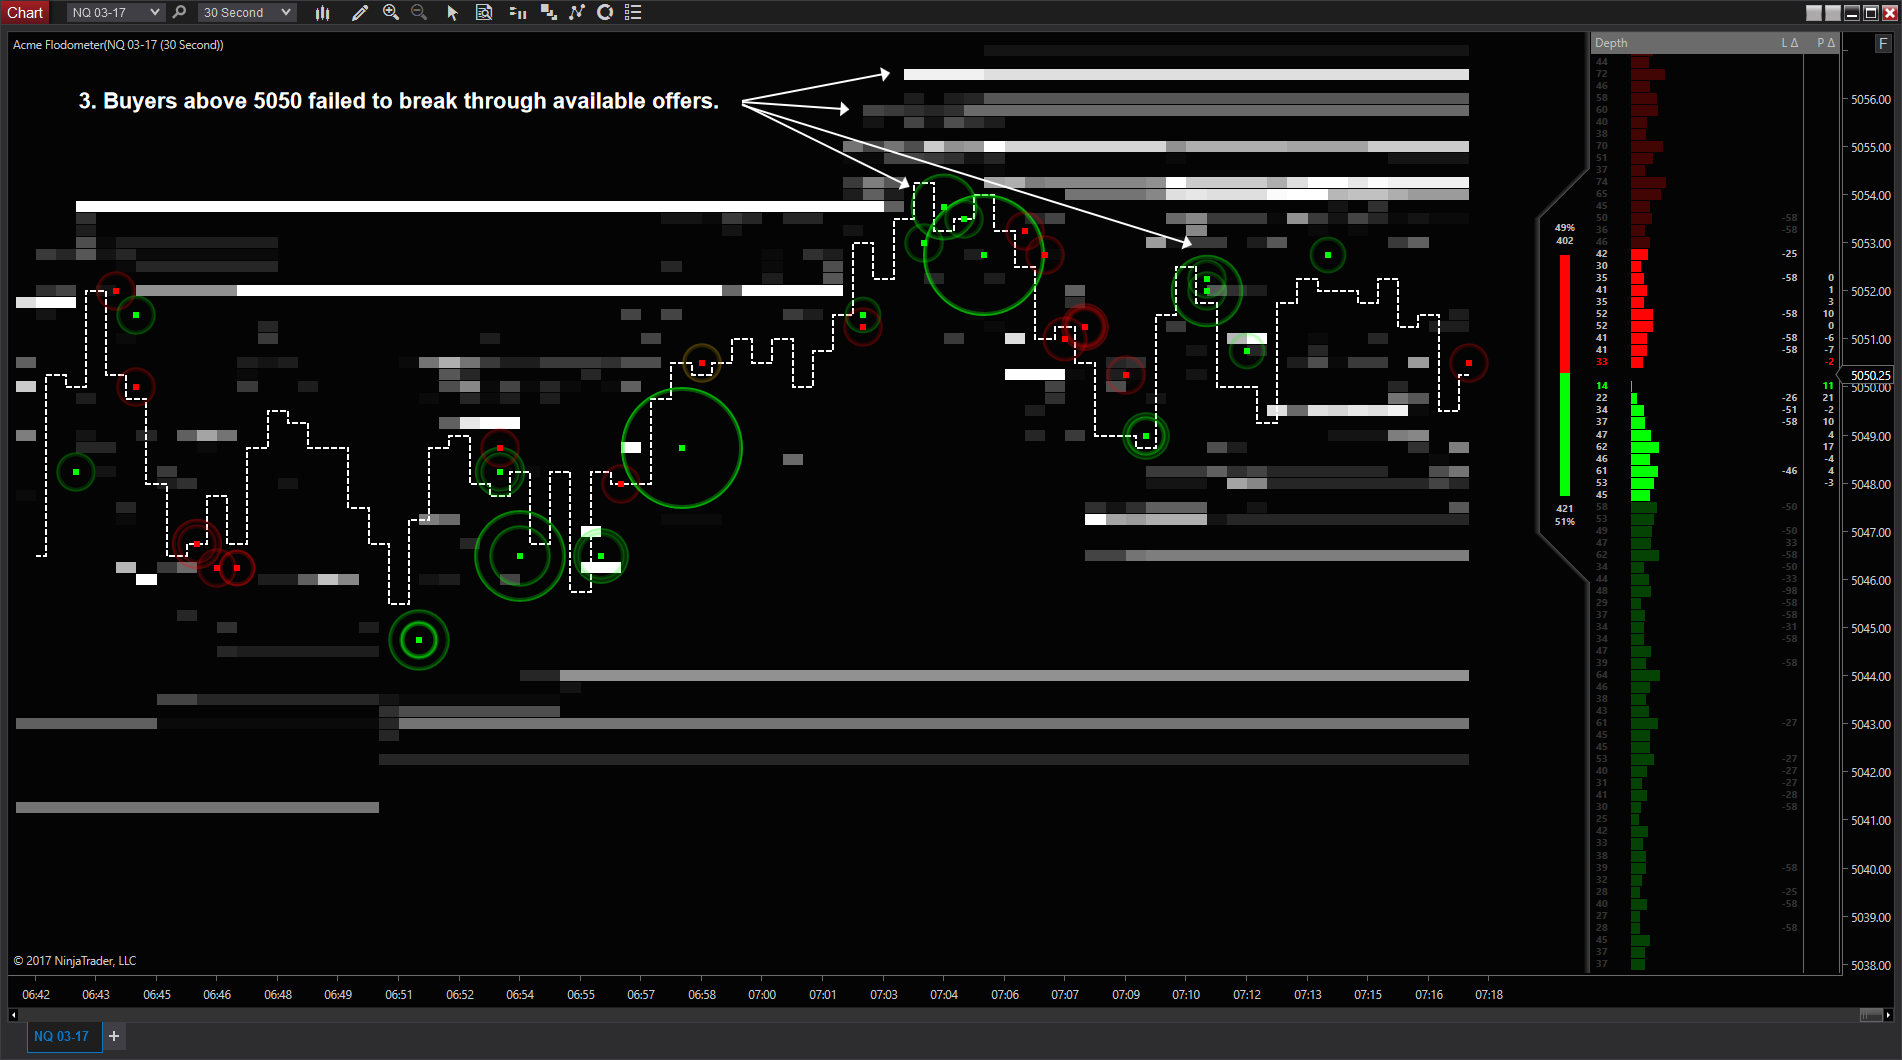
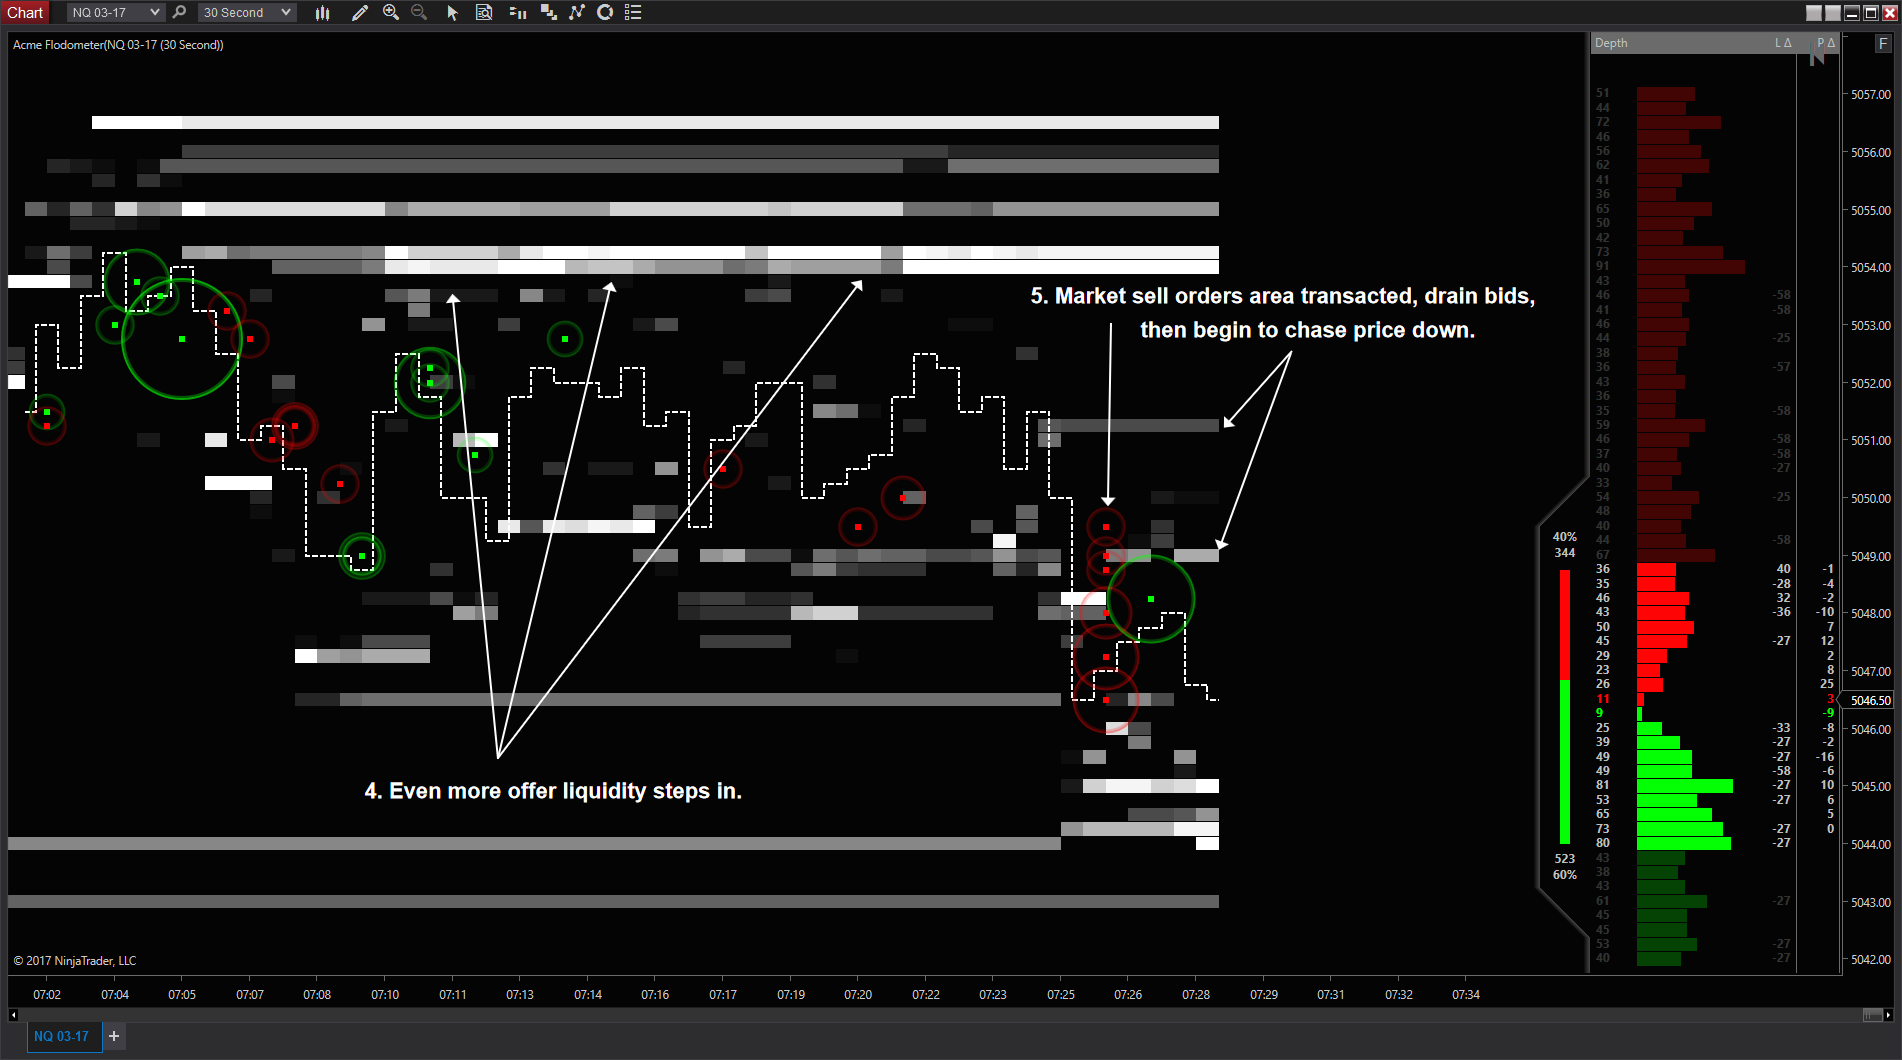
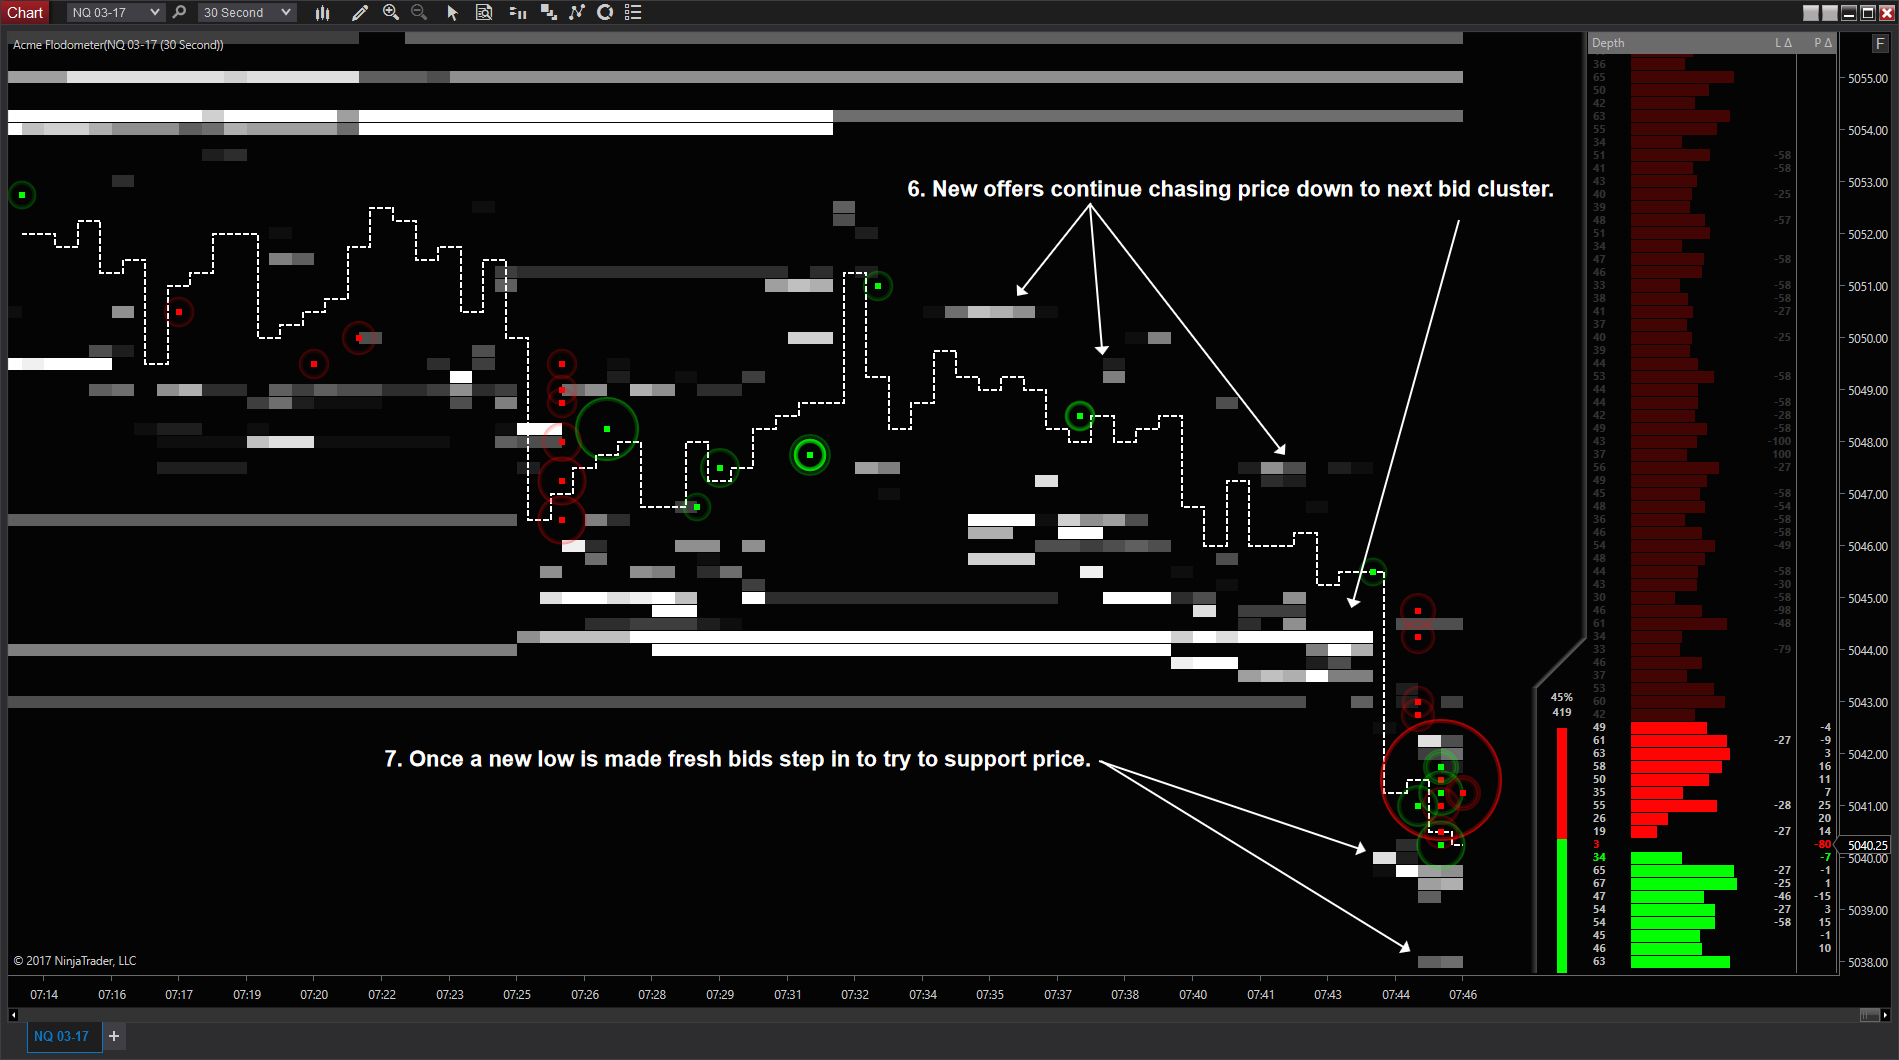
- buyers and sellers moving price to transact with known, available liquidity
- buyers and sellers applying pressure to price to move to a different region of liquidity or market structure
Includes indicator and how-to guide for installation & configuration.
- Description
- Additional information
Description
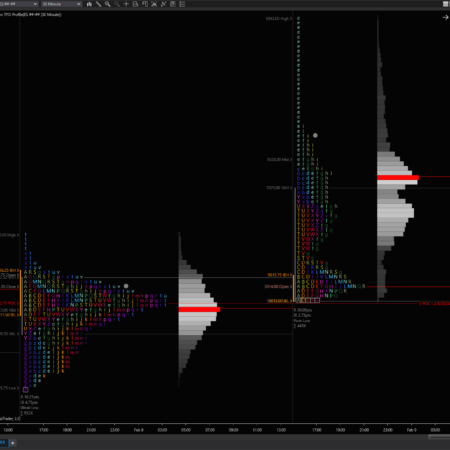
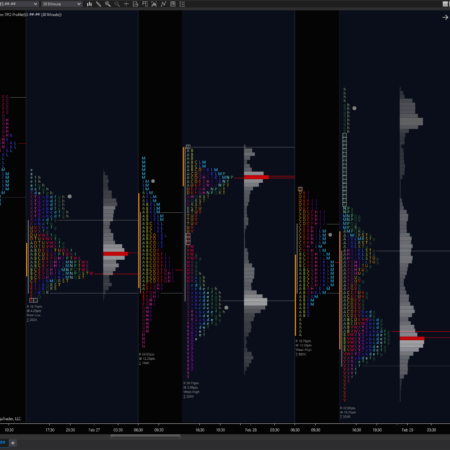
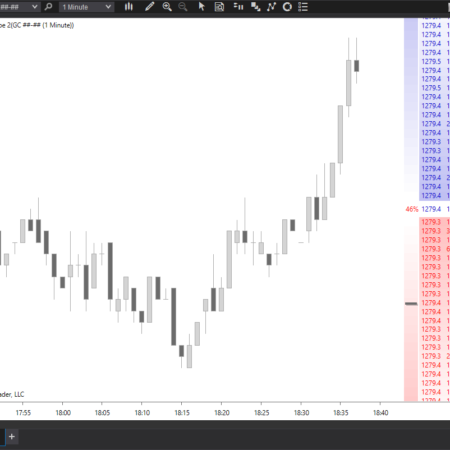
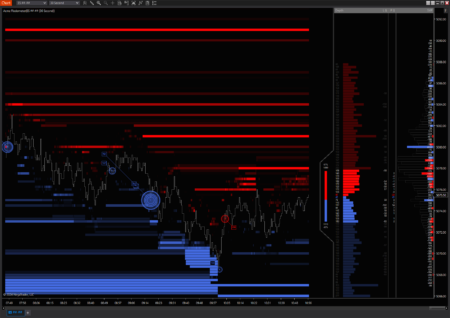
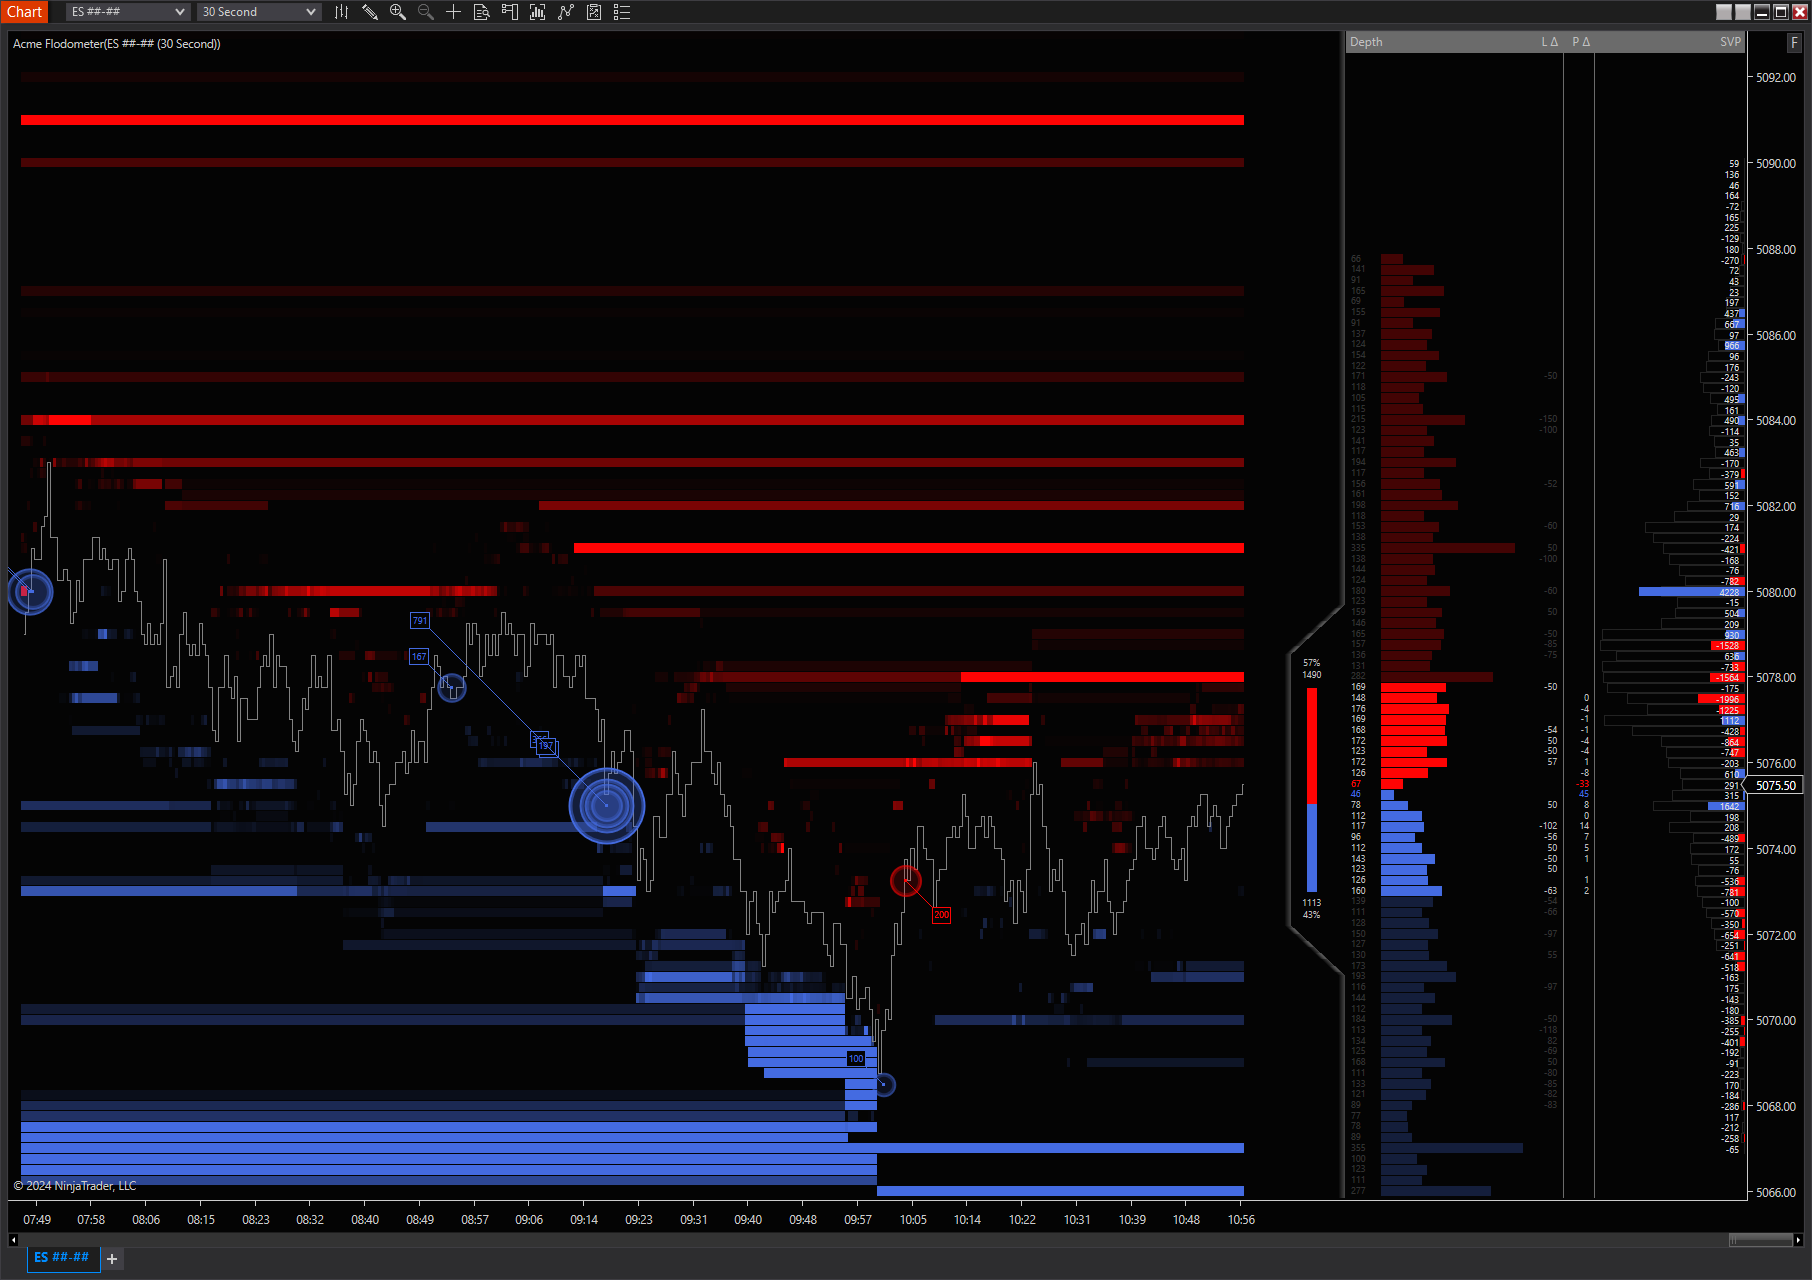
- Watch current and past market depth in both vertical and horizontal dimensions – level 2 order book is shown graphically and numerically.
- See large changes to liquidity-at-price as they happen as well as smaller changes, such as iceberg orders, in real time.
- View the balance of liquidity at a glance, in real time, graphical imbalance, as total volume and as a percentage.
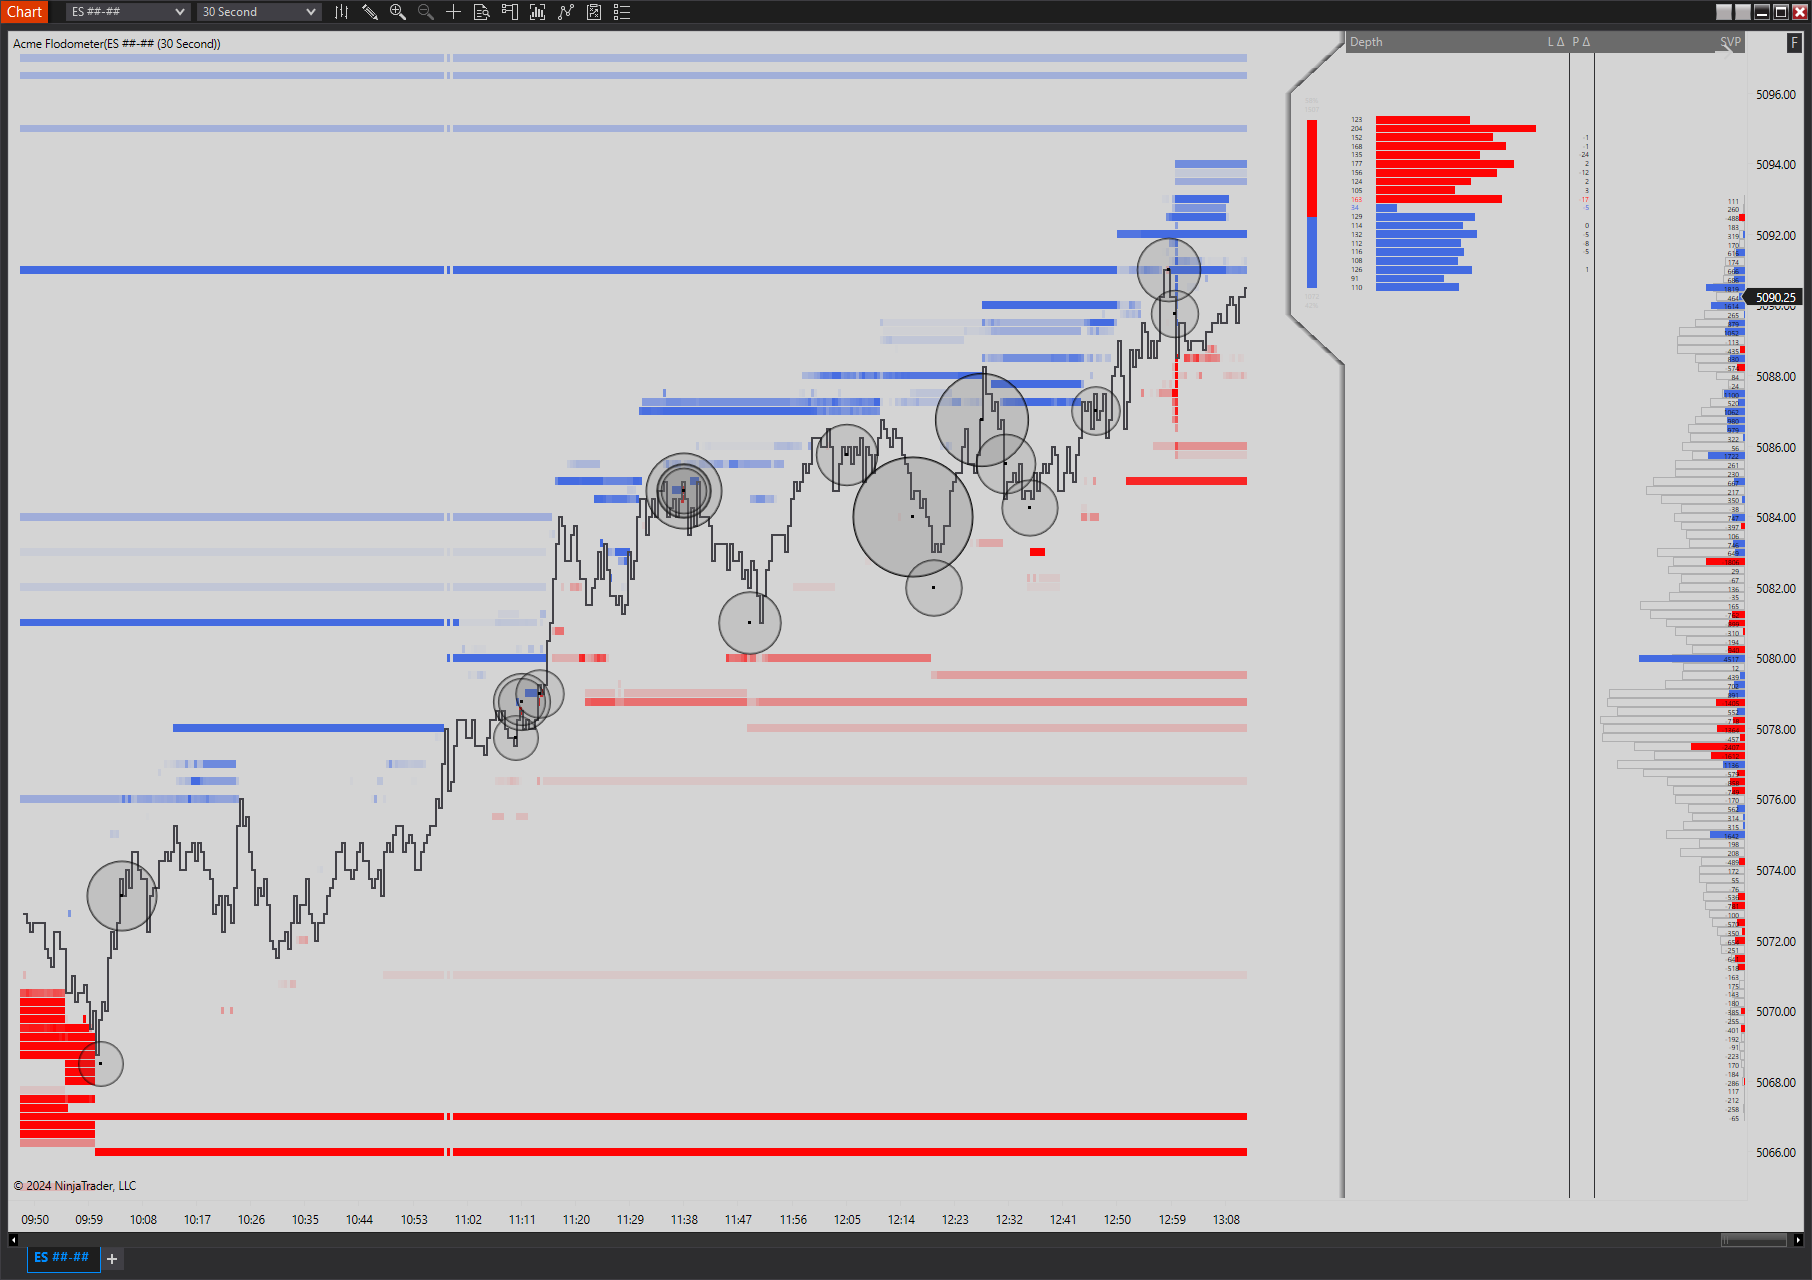
- Instantly adjustable on-chart scaling and contrast adjustment for tuning of the depth history view as liquidity conditions change.
- Use the depth rewind feature to view instant, moment-by-moment replays of liquidity vs transaction behavior.
- Fully configurable large print markers.
- Configurable order book depth support for full depth instruments.
- Records market depth history for continuity when reloading charts.
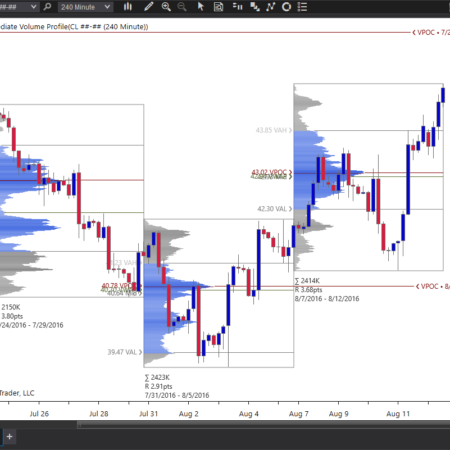
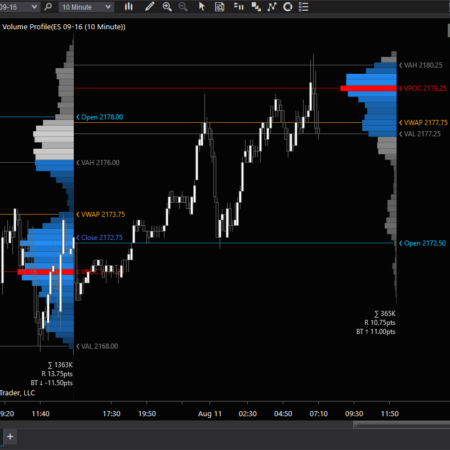
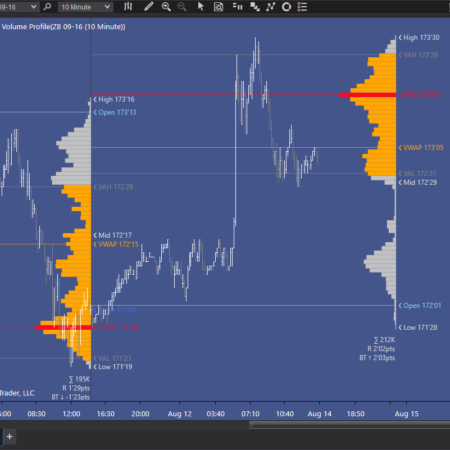
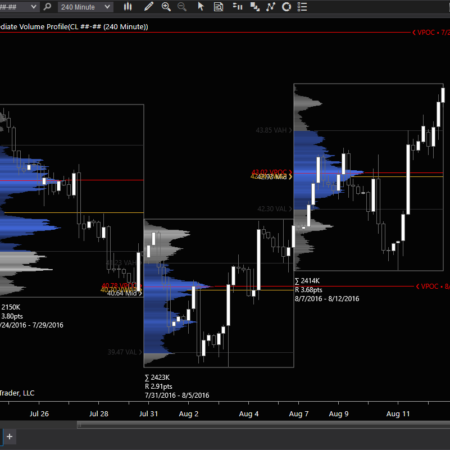
- Profiles the current session in 4 different styles.
- Meter, depth and volume profile columns can be turned on or off.
- Supports both time-based and non-time-based chart bars, such as range, tick, and some renko bar types.
- Unlike other market depth history viewers ours can be used in conjunction with other indicators on the same chart!
- Note this product’s primary purpose is displaying and highlighting short term liquidity additions and removals
- This product requires historical bid & ask data from your broker or data provider as well as market depth (aka Level 2) data for the instruments with which you intend to use this product. Be sure to verify availability of this data from your provider prior to purchase!
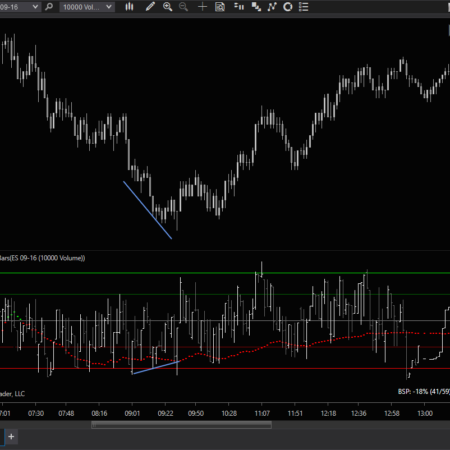
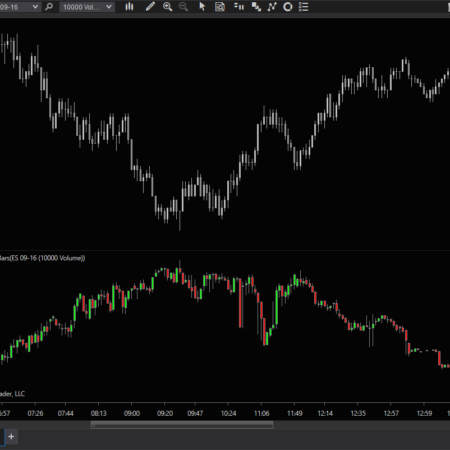
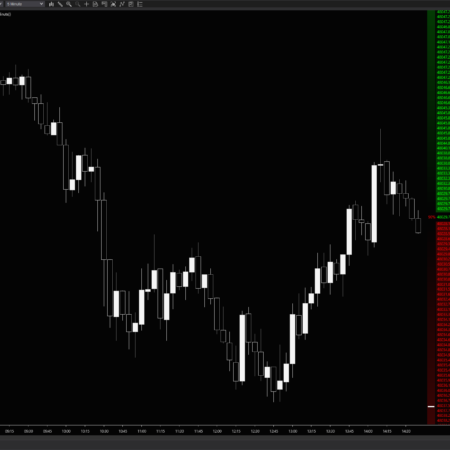
See it in action:
Order Flow – Example 1
Additional information
| Supported Markets | Futures |
|---|---|
| Time Frame | Intraday |